Sustainability Performance
What gets measured, gets improved. Transparency on the material environmental, social, and governance performance results signals that the company is monitoring progress toward sustainability goals and increases confidence in the company’s ability to create sustainable value for all its stakeholders. Furthermore, sharing results creates an opportunity for benchmarking for others to follow, thereby increasing the speed of learning.
Transparency creates accountability, not just for the company but also for its stakeholders. Better transparency in reporting ESG outcomes can restore trust in business by showing that it is taking action on sustainability. It can also mobilize stakeholders to contribute to the progress towards sustainability goals. Addressing sustainability challenges requires collaboration between multiple stakeholder groups in a long time-horizon, and trust is essential for that collaboration to be impactful and long-lasting.
Materiality analysis not only allows the company to prioritize their sustainability efforts by considering the G(EES) issues most related to its business, but also to inform sustainability reporting and communication with its stakeholders. Issues material to performance constantly evolve, so ongoing analysis and dialogue with stakeholders is essential for companies to focus on their sustainability efforts on what matters for their performance and their stakeholders both in the short and long-term.
Holistic Approach in Sustainability
Sustainability Governance Scorecard© assesses sustainability performance in a holistic manner; analyses whether the policies and guidelines are materialized, whether disclosed performance covers all areas including environment, social, and anti-corruption, as well as all the operations, all organizational levels, supply chain, and the product life cycle. To assess implementation coverage, we looked for evidence in comprehensive reporting of sustainability performance across key performance indicators. We also evaluated the holistic approach in sustainability which includes setting policies, KPIs and targets and sharing results and evaluation of results across specific ESG categories.
Recommendations
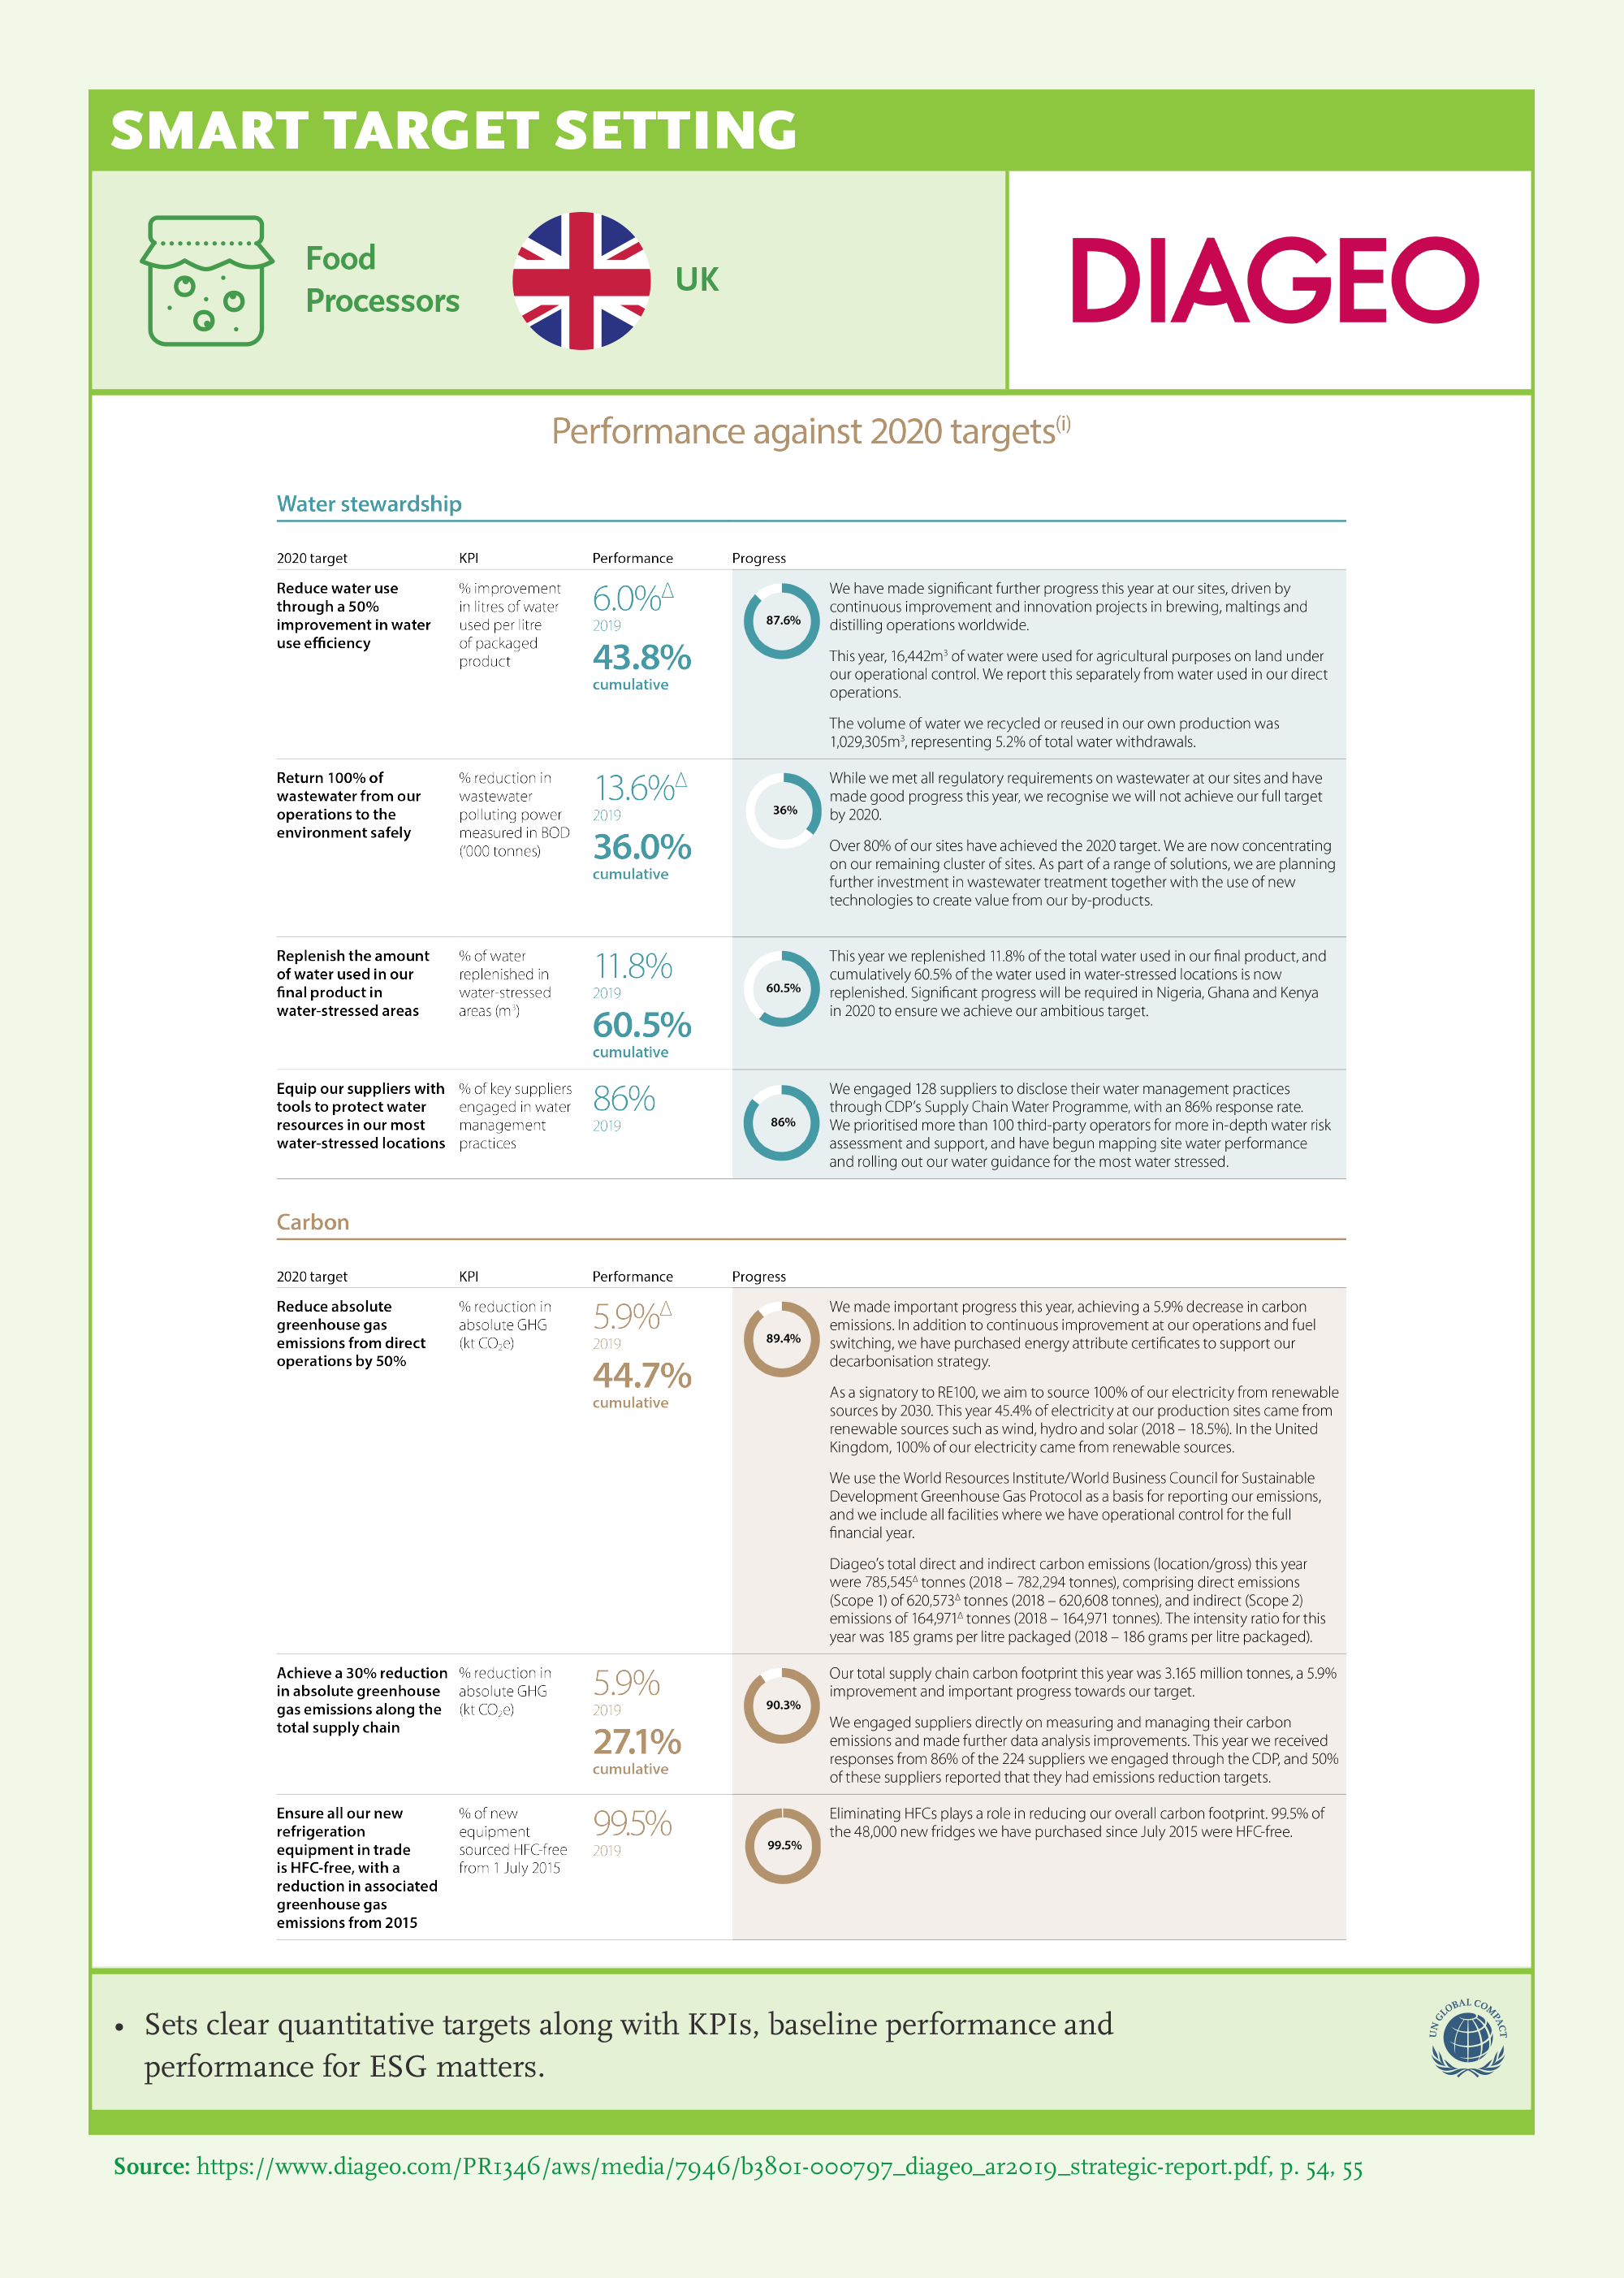
- 1Set KPIs for economic, environmental, and social issues, and governance of all; and SMART targets in line with what matters to focus attention on improving sustainability performance. Report results to monitor progress on G(EES) related outcomes.
- 2Assess results and share remedial action to address gaps in sustainability.
- 3Cover all employees, geographies, and the supply chain in a sustainability performance approach.
- 4Develop a reliable, consistent set of indicators to measure intangibles (e.g. corporate culture, human capital, diversity, and inclusion).
- 5Cooperate for the development of a unified reporting framework –standardization and comparability of sustainability data, methodology and metrics.
- 6Communicate the value of metrics and feedback on its usefulness for decision making processes.
- 7Define and prioritize material issues covering governance of all economic, environmental, and social dimensions for the company and its stakeholders.
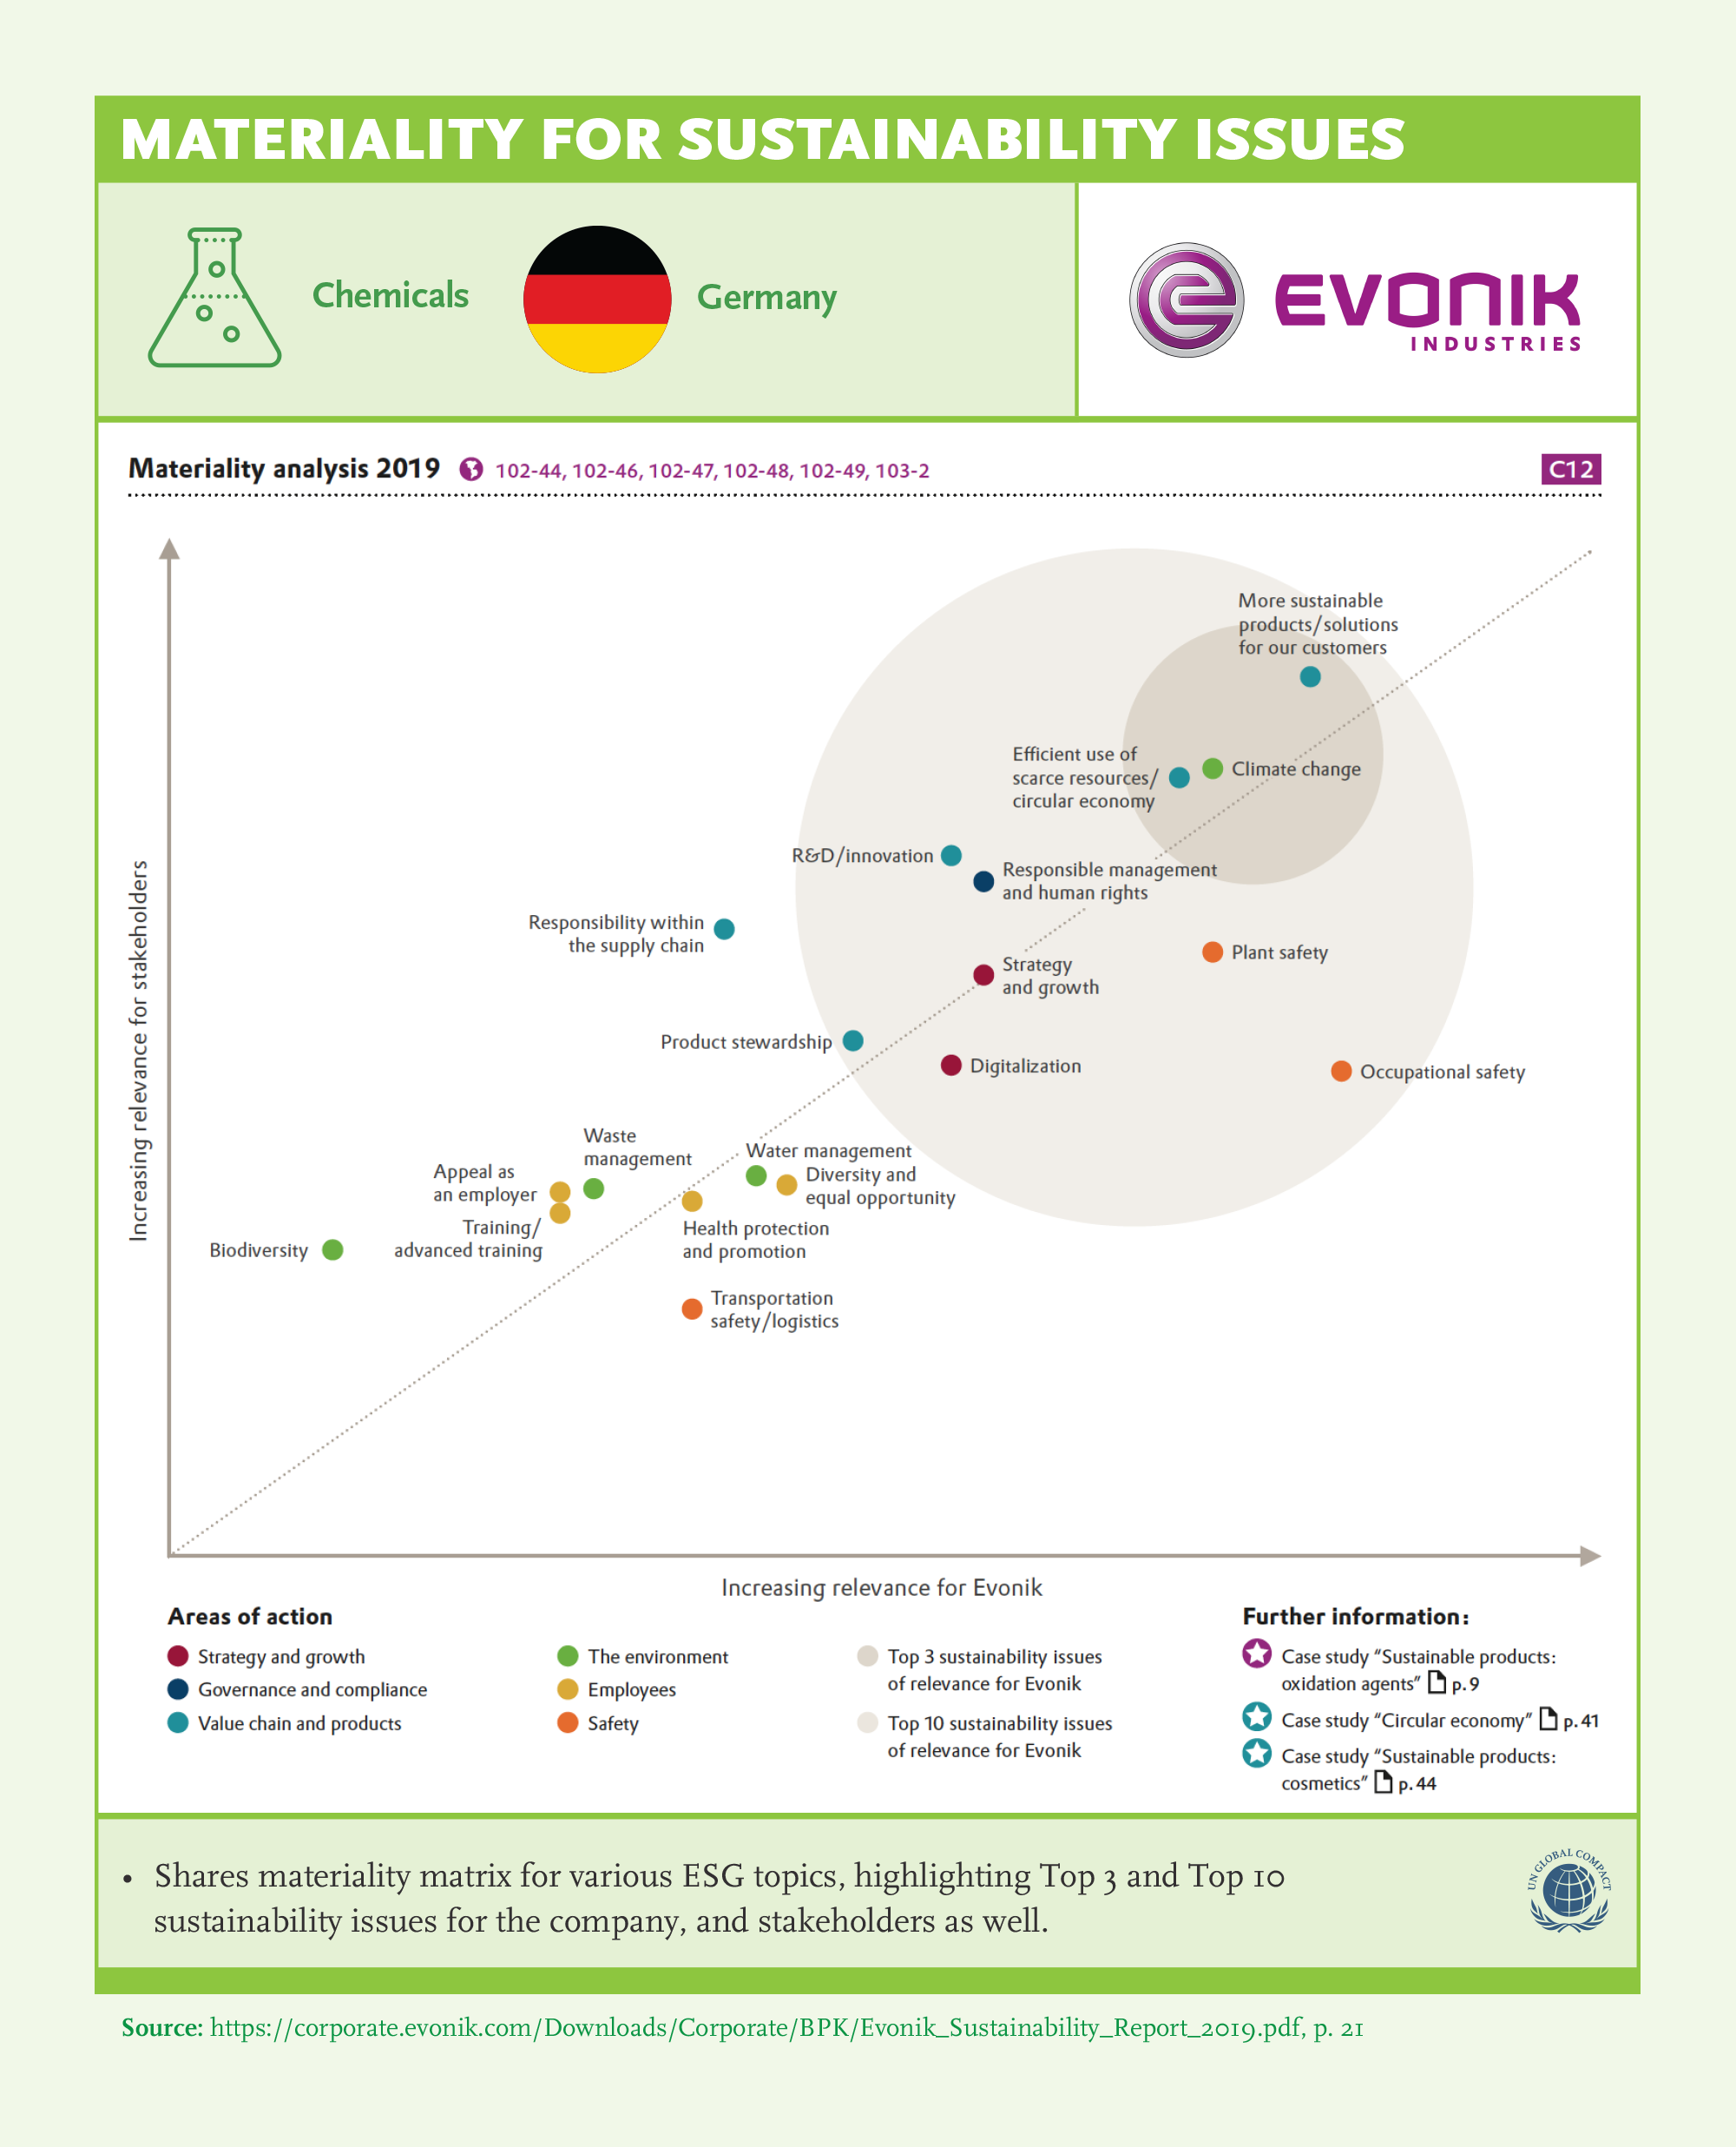
- 8Publish a materiality matrix.
- 9Use reporting as a tool for transparency on communicating with stakeholders on what matters.
Key Findings
Materiality
Material matters are broadly defined, as per GRI guidelines, as issues that have impact on an organization’s ability to create, preserve or erode economic, environmental, and social value for itself, its stakeholders and society at large. Investors are increasingly looking for evidence that companies in their portfolio are focused on the material ESG issues that matter to financial performance and a well-defined commitment to sustainability.
Best-in-class companies use materiality analysis to gather insight on the relative importance of economical, environmental, social, and governance issues and prioritize sustainability efforts around areas where they can have the greatest impact.

- 89% of the companies share a list of material G(EES) issues and 90% share the process for selecting material issues. All companies in Consumer Goods and more than 95% in Natural Resources share material issues and processes for selecting materiality issues.
- 79% of the companies share assessment of material issues for the company (prioritization) and 72% share for their stakeholders. There is a 19% increase in sharing the material issues for stakeholders in comparison to SGS 2020.
- German and Chinese companies show outstanding performance in all areas of materiality that we examine. However, all countries have the potential to improve in materiality matrix sharing.
- Only half of the companies in our sample share materiality matrix. GSLs should assume more responsibility on this topic. Sharing of materiality matrix is observed highest in Chemicals (78%) and lowest in Pharma (33%).

- Climate Change is the top listed material issue (83%). It is followed by Occupational Health and Safety (both 72%), and Talent Development (70%). When we look at the country basis, Climate Change is mostly considered by Chinese and German companies whereas Energy, Technology, and Innovation topics are relatively considered more by Chinese companies.
- Climate Change, Waste and Human Rights are mentioned as materials by all Consumer Goods companies, followed by Natural Resources on Climate Change and Waste issues (more than 90%).
- The issues of Occupational Health and Safety were specified as materials (more than 85%) by Consumer Goods and Natural Resource companies.
- There is an opportunity for improvement for all companies in determining economic material issues.
- Companies that adopt any of the initiatives both share their key issues and how they are identified (more than 94%).
- More than 90% of companies place Human Rights among the most important issues (75% for companies that do not adopt any of the initiatives).
- More than 80% of companies indicate that Climate Change is one of the most important issues.
- UNGC companies express that Occupational Health Safety and Talent Development are among the important topics (more than 80%).
Climate change is the top listed topic in material issues (83%) which is the most adopted issue with a holistic approach (75%).
Sustainability Performance
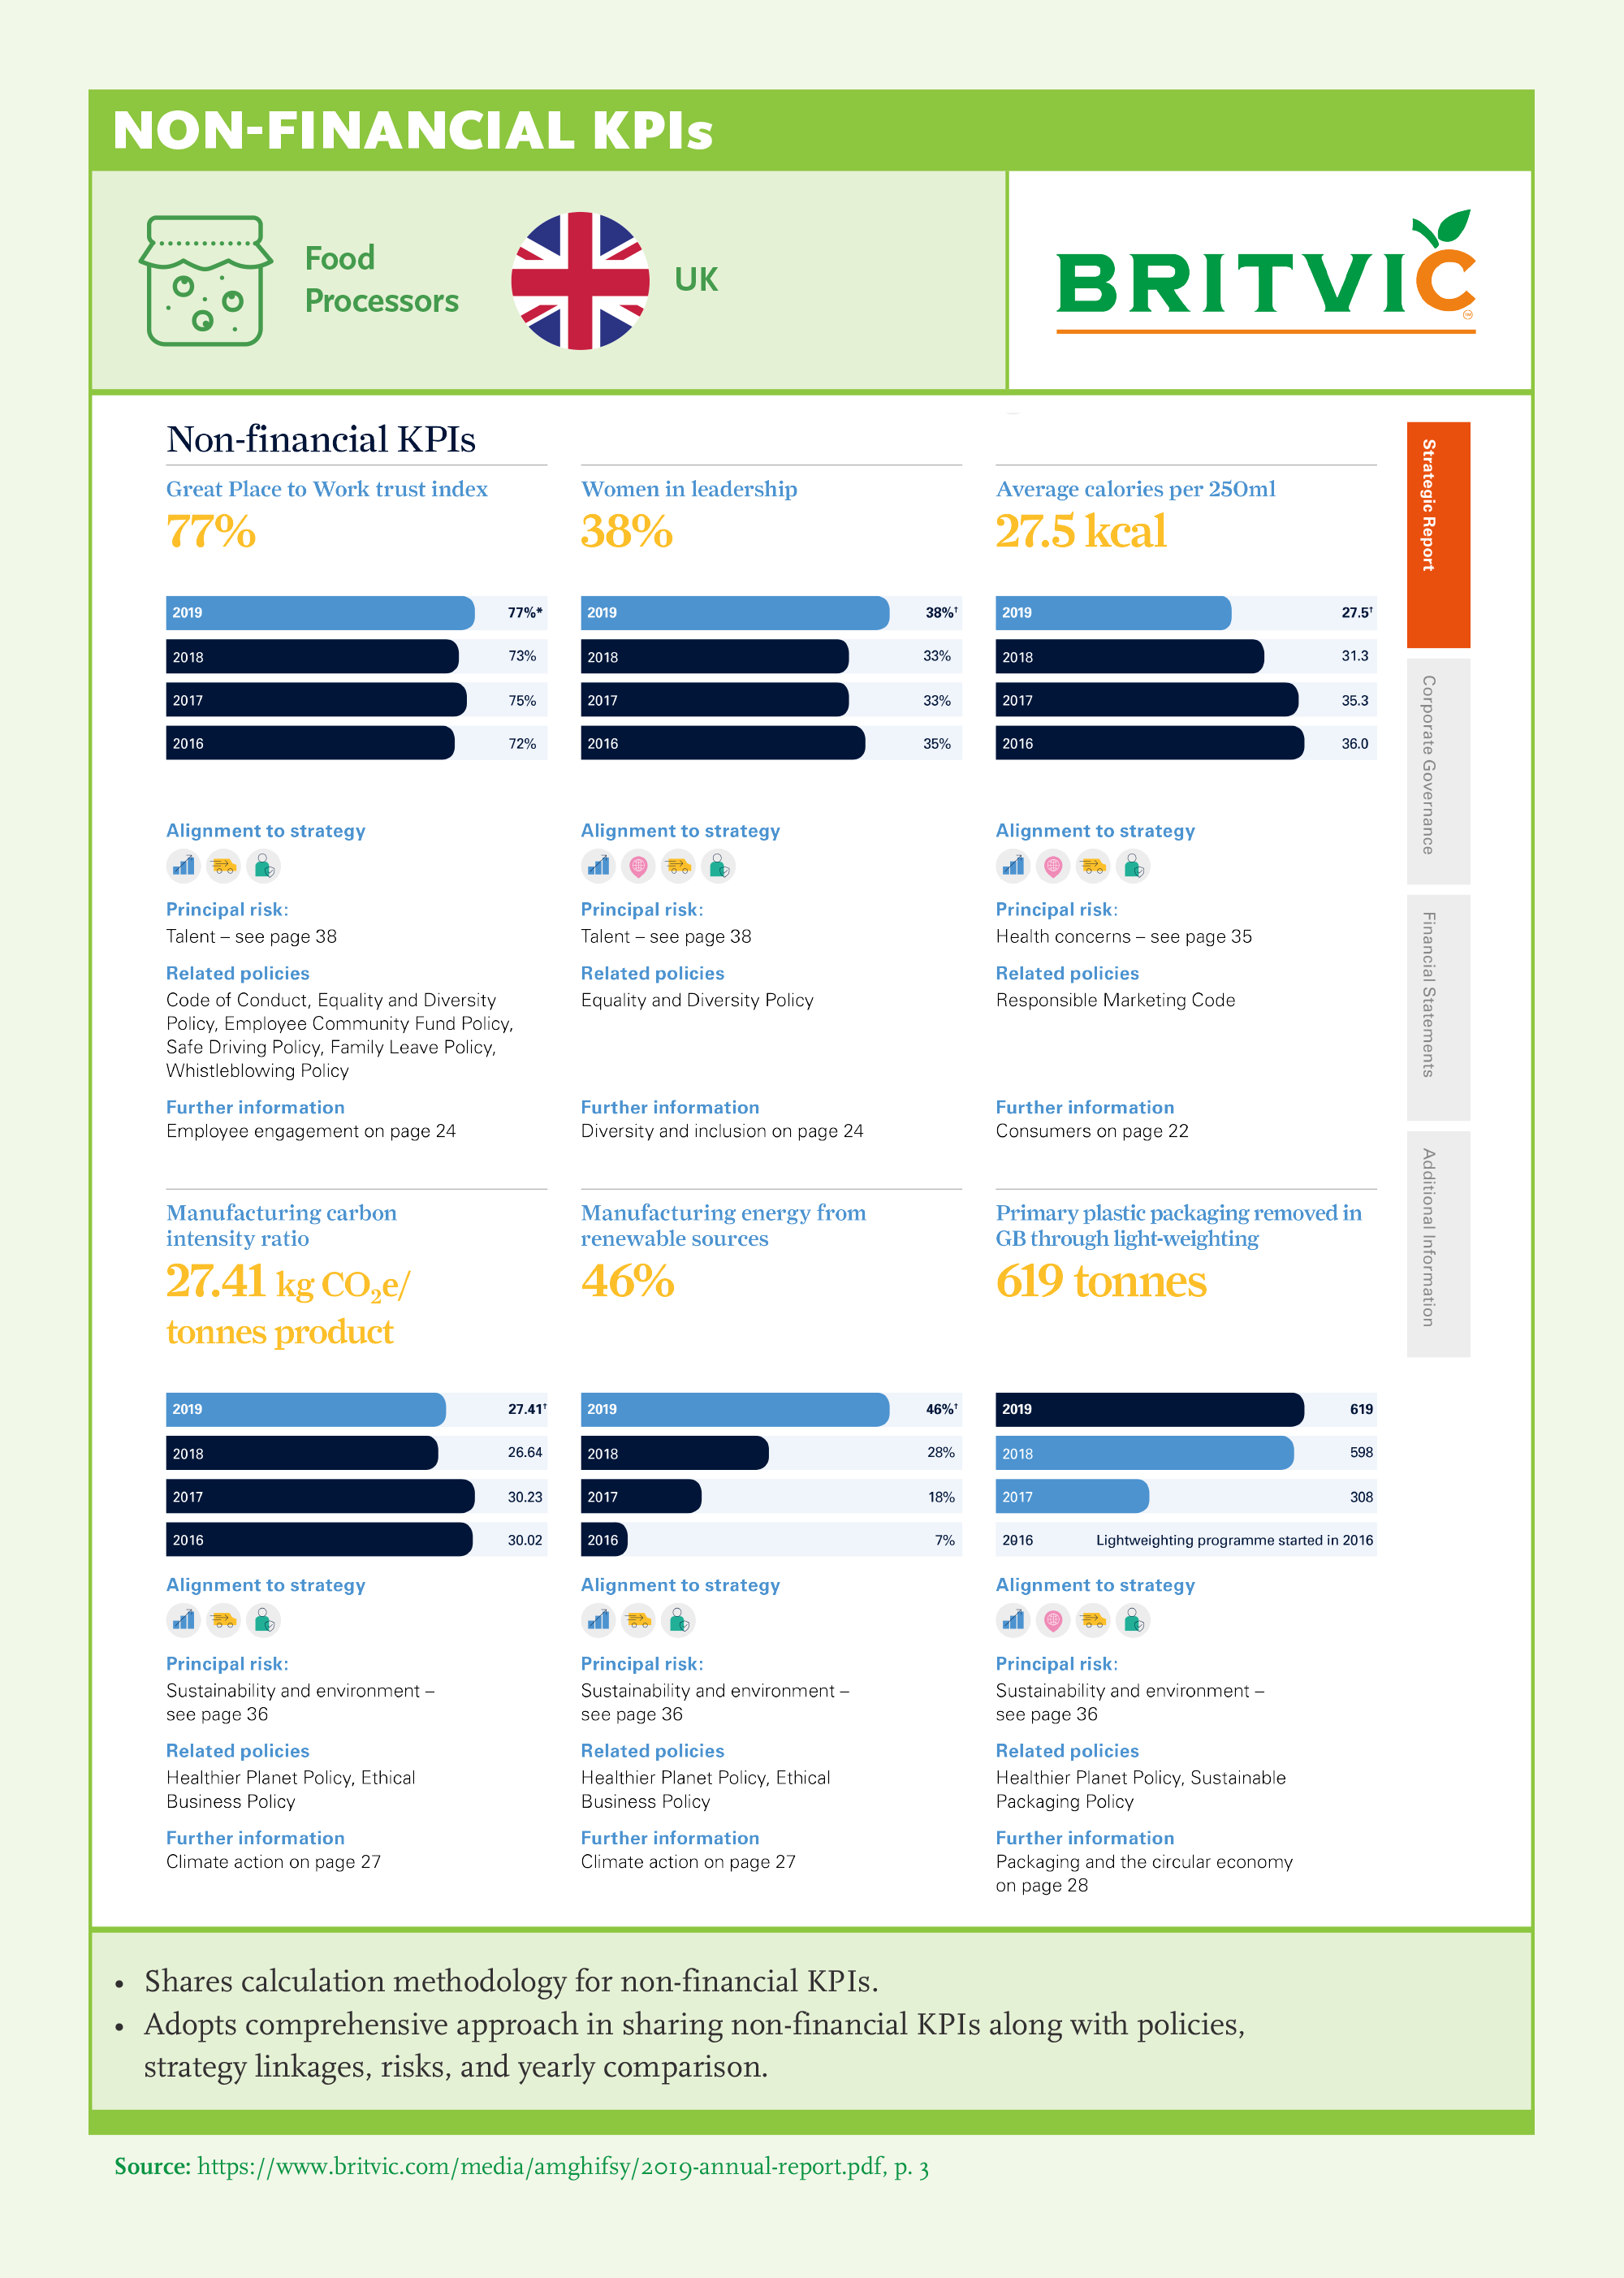
Global Sustainability Leaders have successfully integrated policies, KPIs, and results to include environmental, social, and governance issues, however there is room for improvement. As part of our research, we evaluated whether a company sets policies, KPIs and targets and shares results and evaluation of results across specific ESG categories. We find that 81% of companies consistently report on environmental topics, 68% on social topics, and 84% on governance topics.

- Climate Change is the most consistently reported environmental topic; there is significant room for improvement in consistent reporting in Responsible Sourcing, Hazardous Materials, and Biodiversity.
- In terms of consistent reporting, Waste and Packaging improved the most in comparison to SGS 2020.
- The gap between sharing policy and setting targets is highest for Compliance, Product Design & Safety, Hazardous Materials, Biodiversity, and Responsible Sourcing (more than 50% gap).
- Companies that consistently report on social sustainability performance focus mainly on Health and Safety metrics. Almost all companies have a policy and share results for Diversity & Inclusion, Talent Development and Employee Wellbeing, but there is room for improvement in setting targets in these categories.
- Data Security and Customer Privacy policies are set by almost all companies, however there is a room for improvement in target setting, results sharing, and results evaluation.
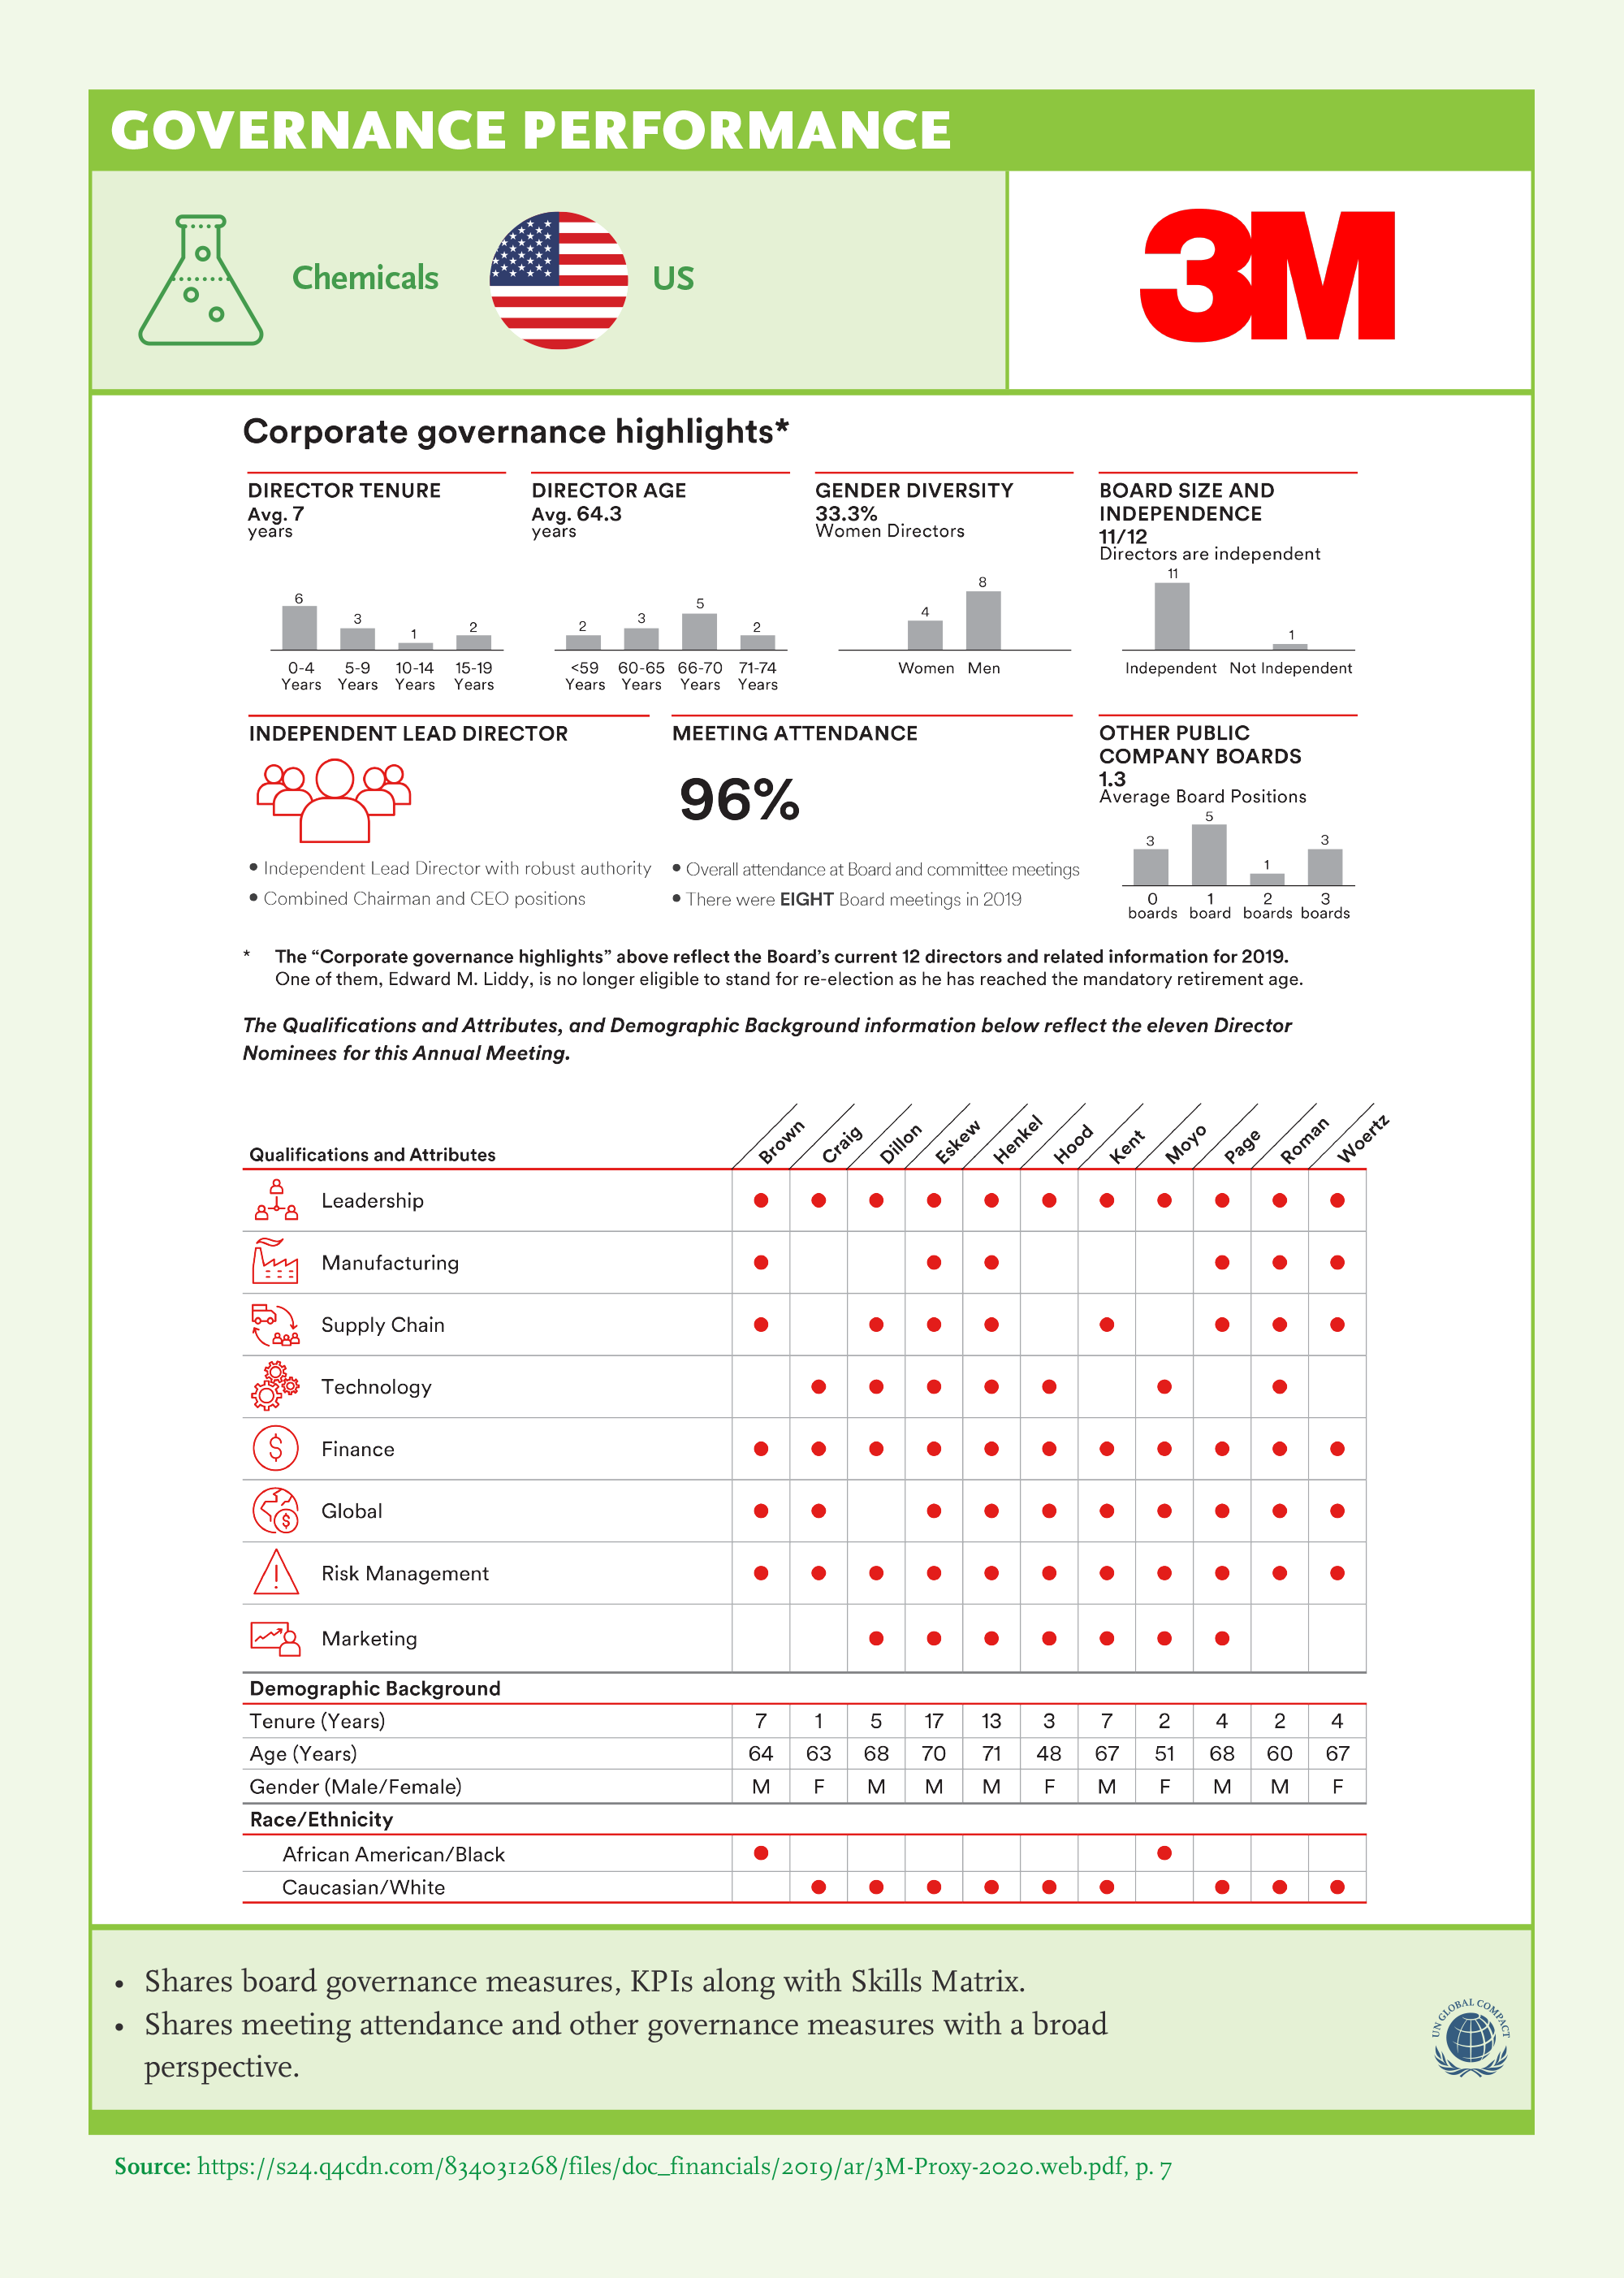
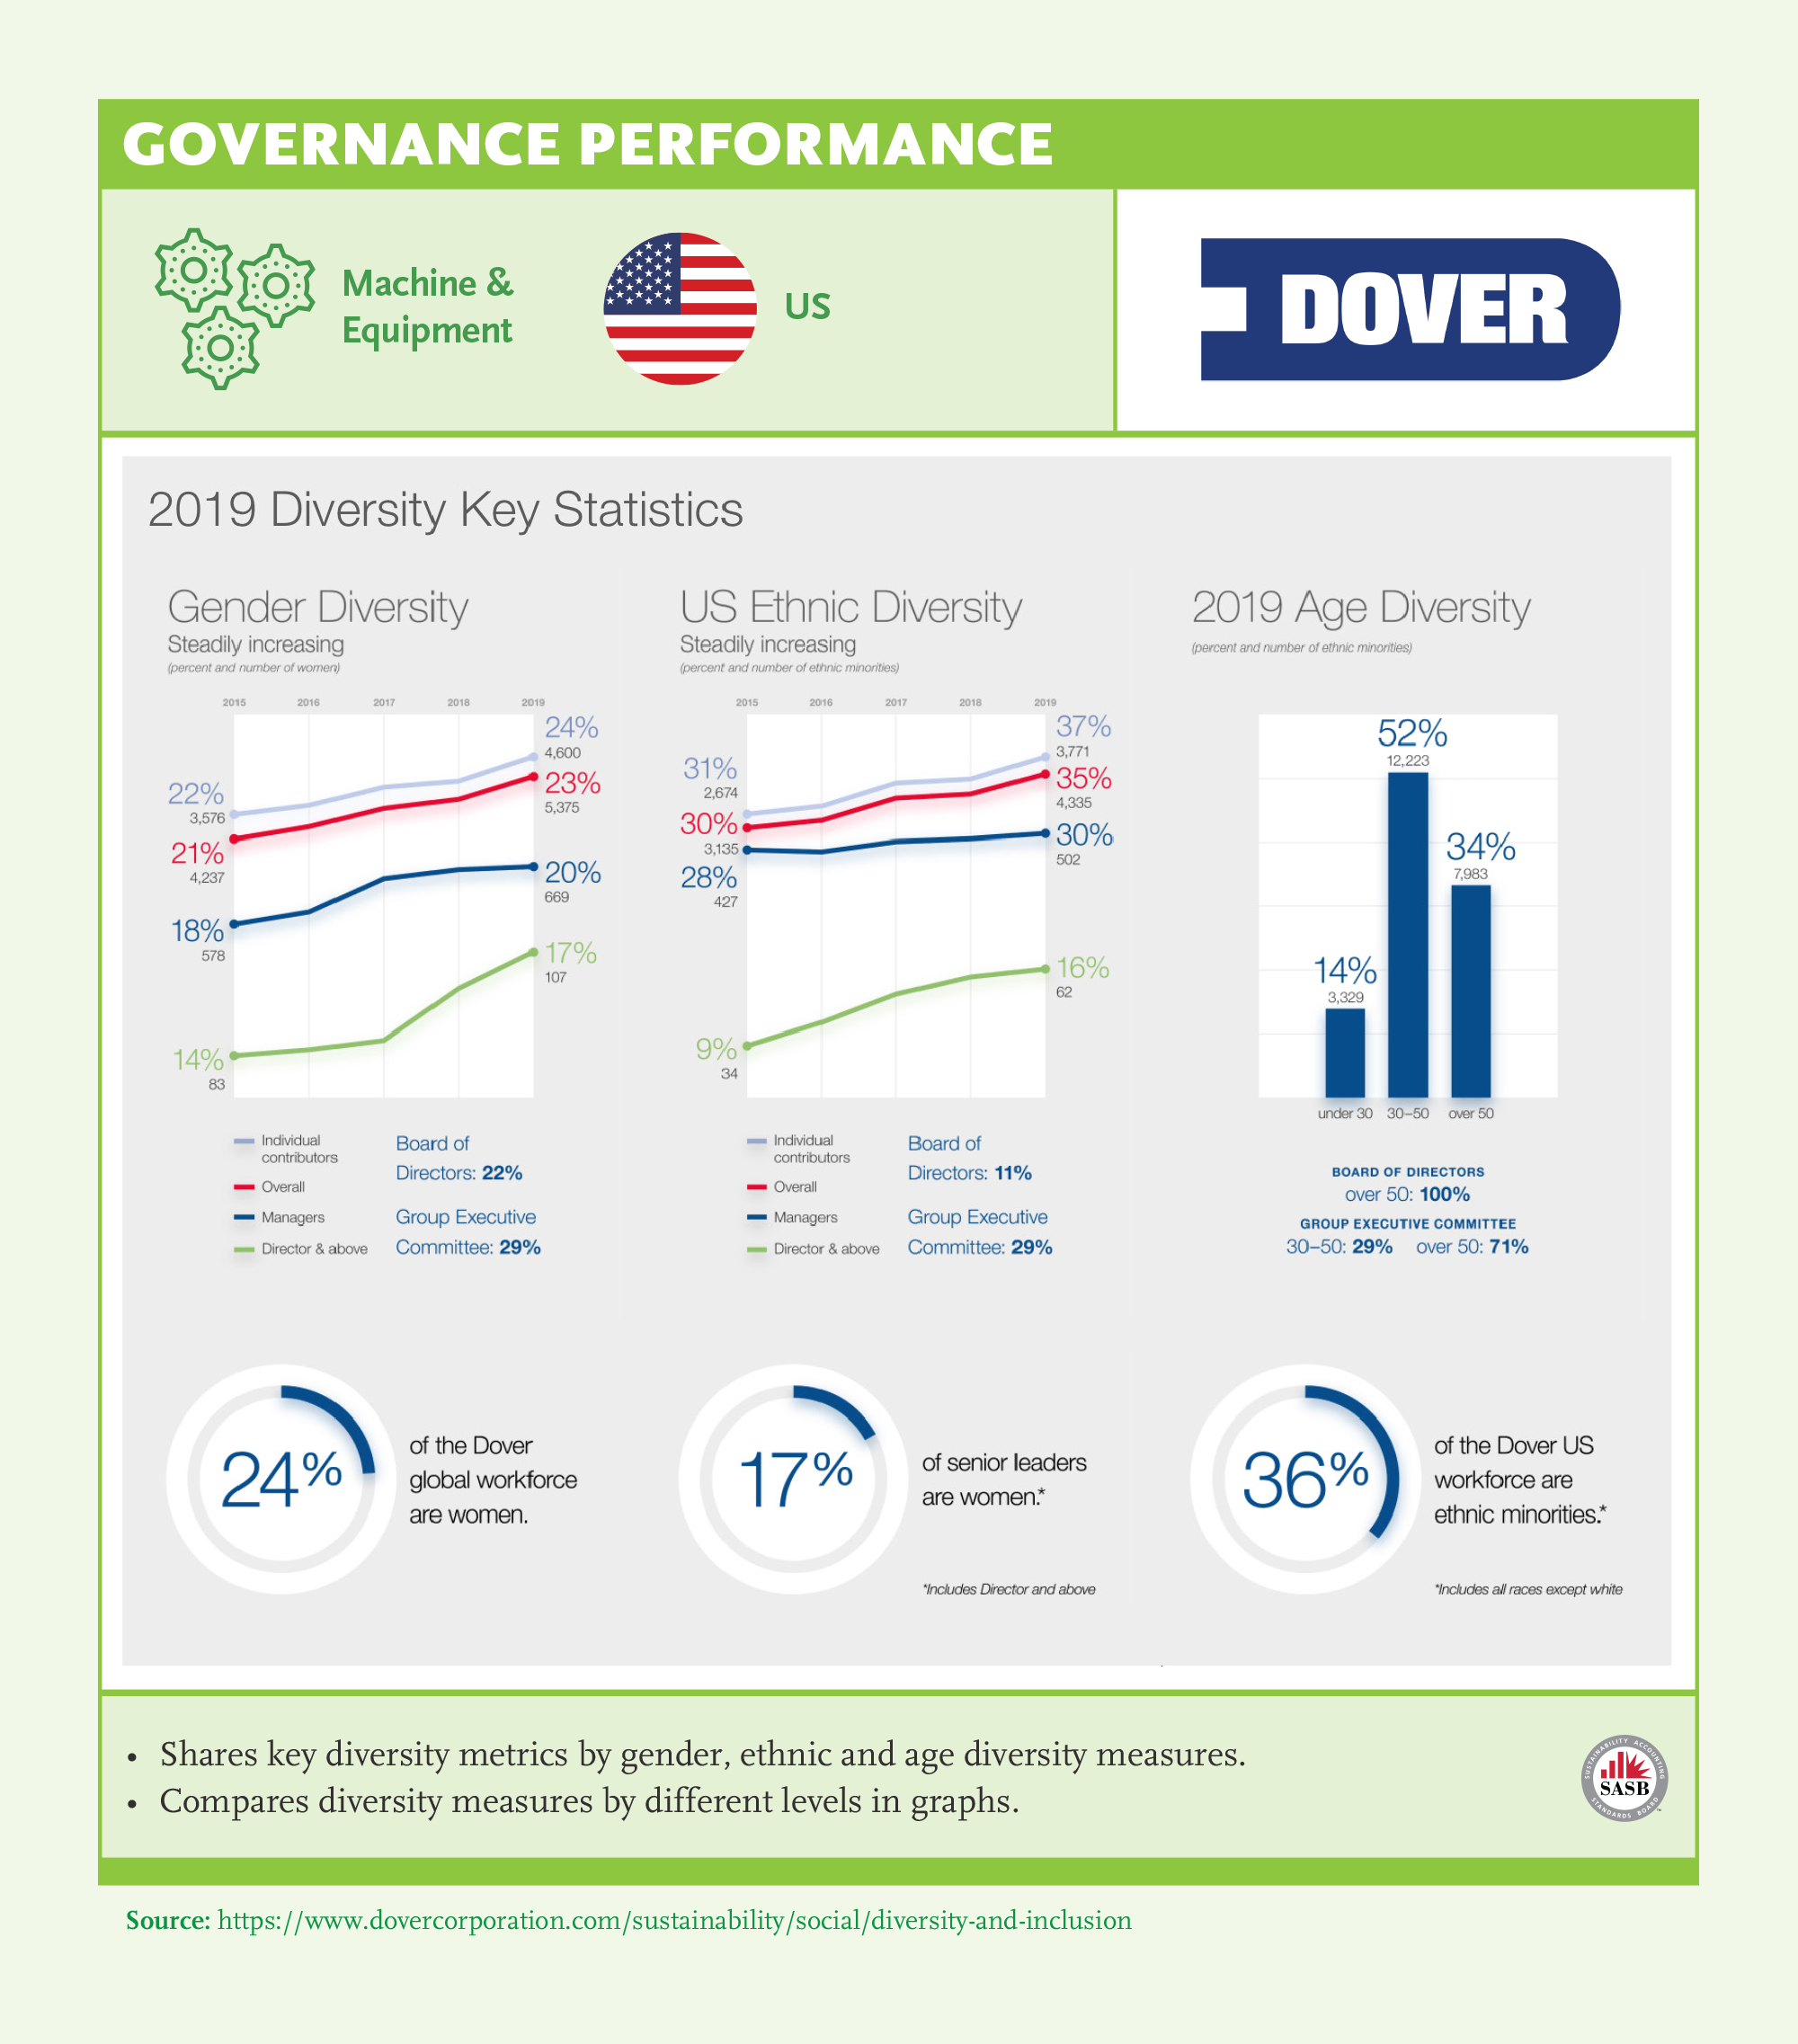
- There is also room for improvement in setting targets and assessing results on governance areas. 69% of the companies report consistently on Executive Compensation, 33% for board diversity and only 10% on Compliance (Ethics, Anti-corruption, etc.)
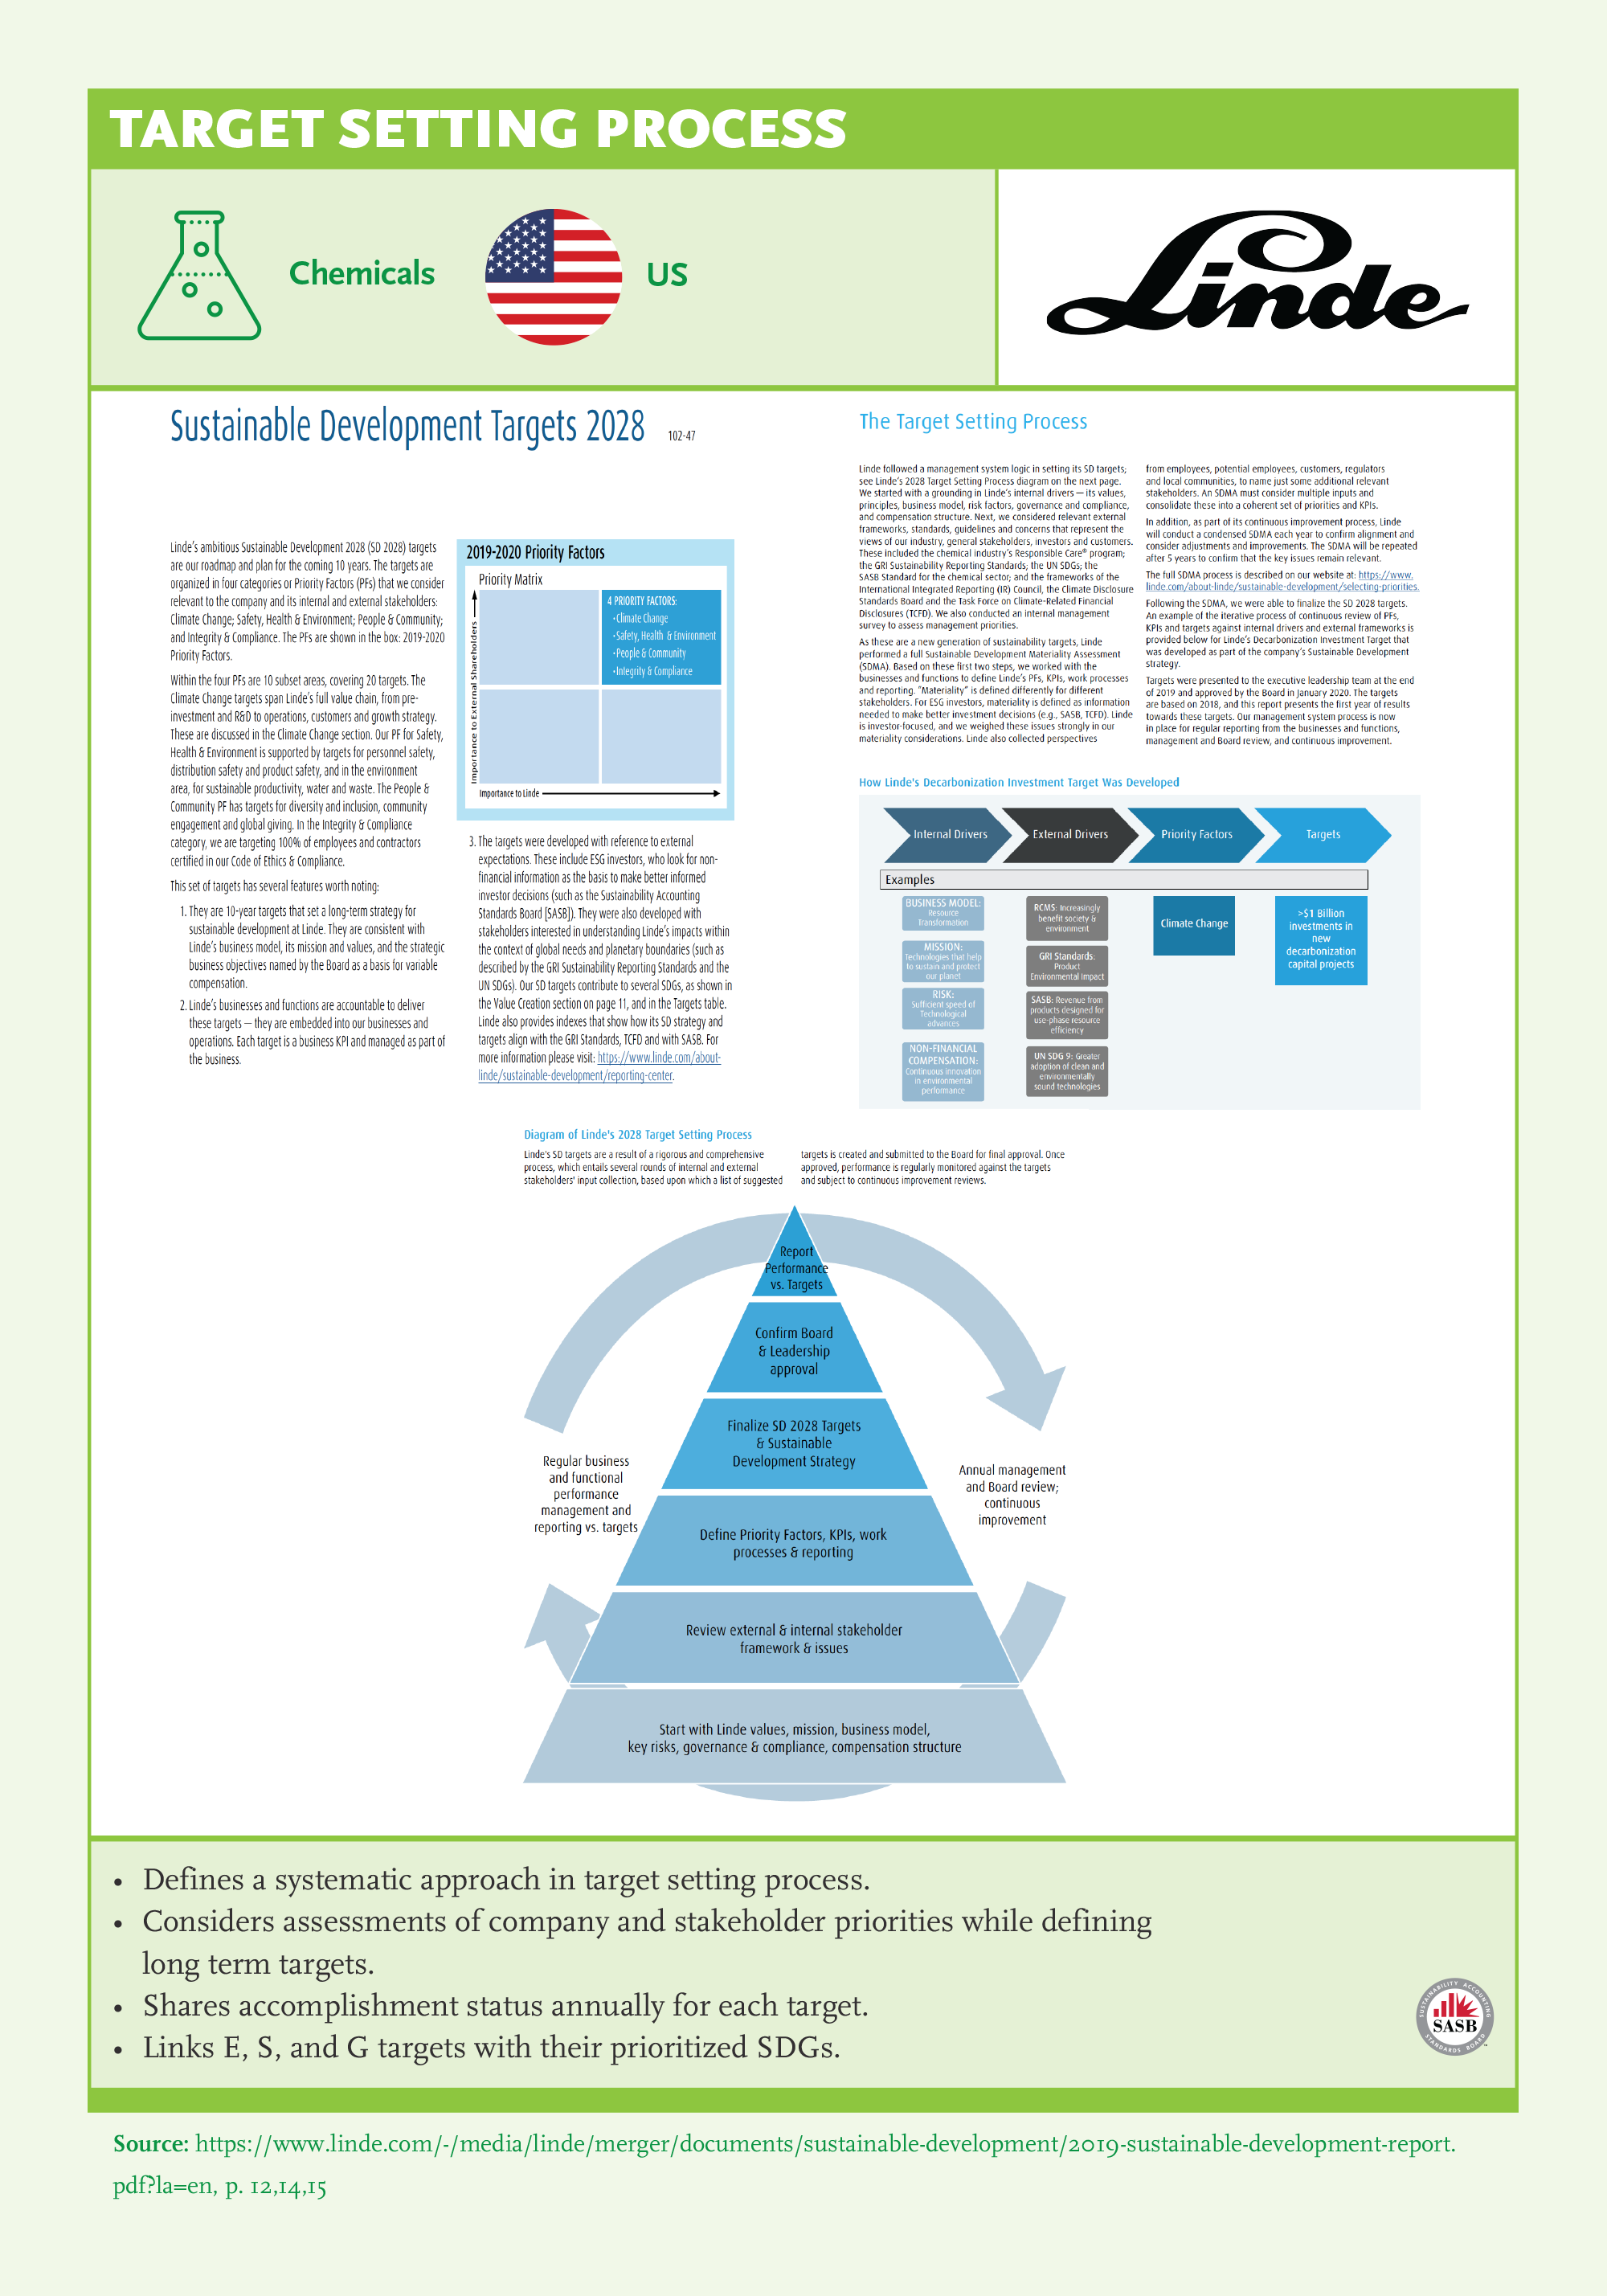
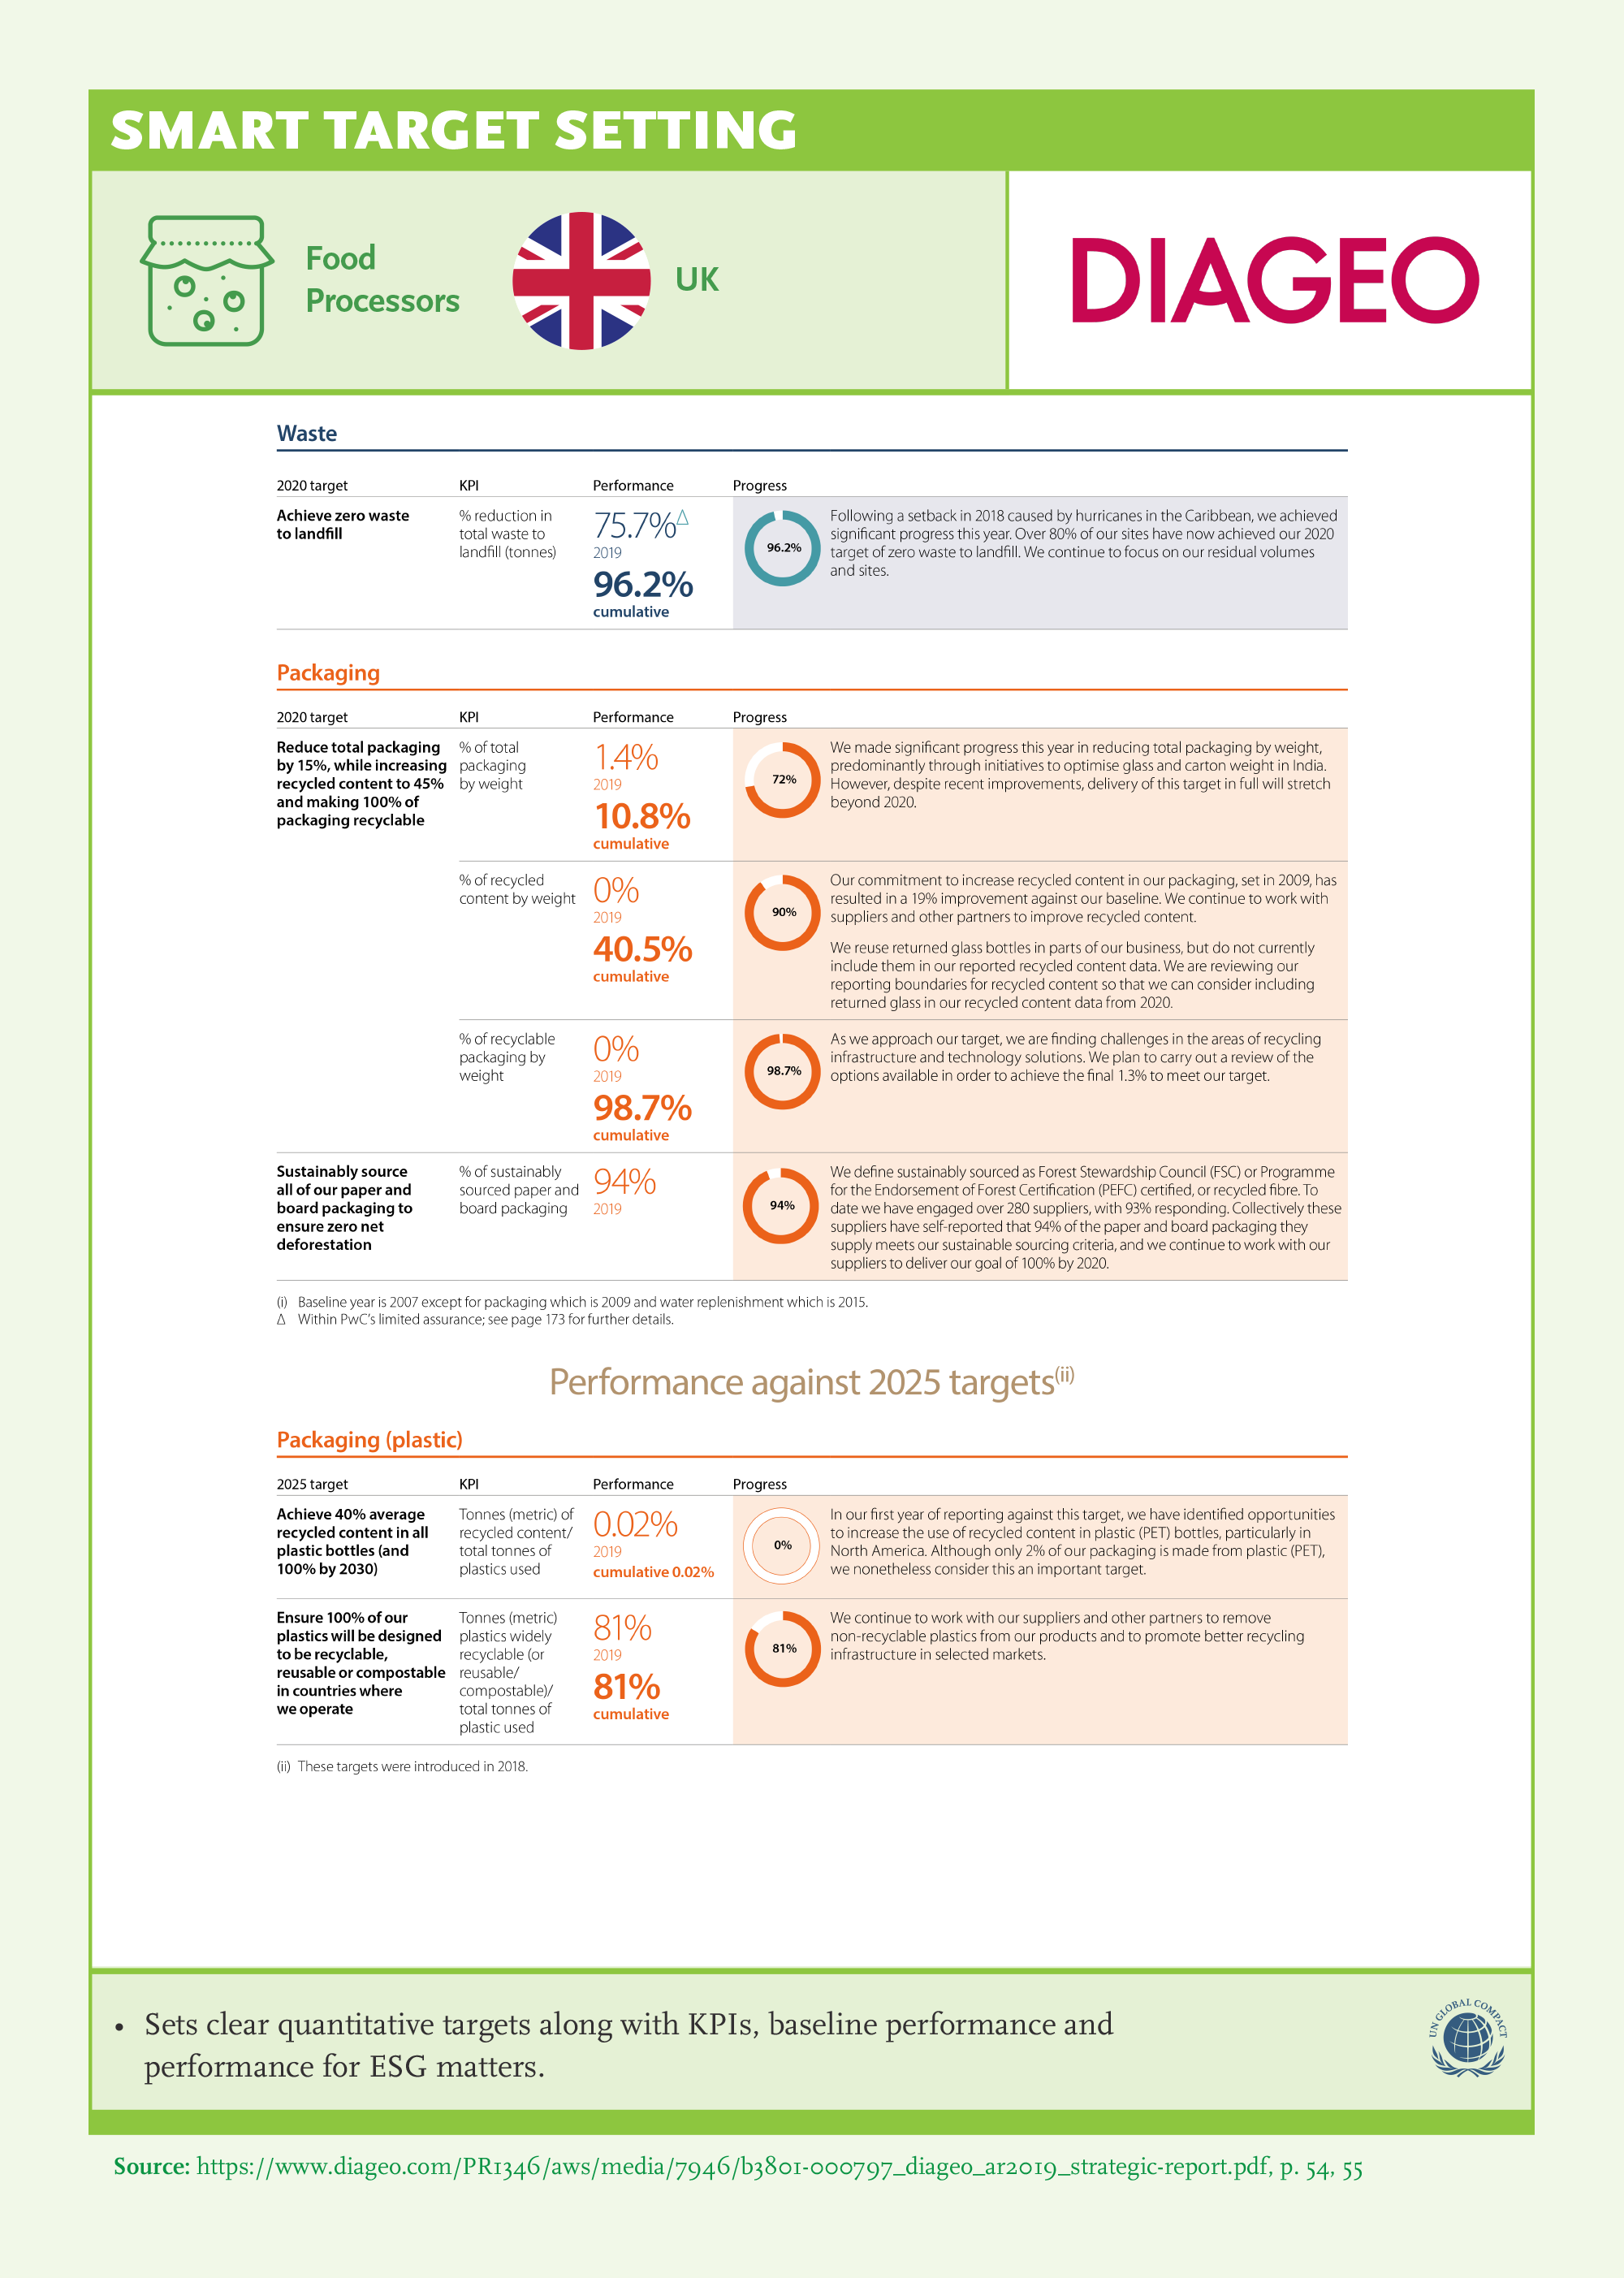
Setting SMART Targets

- More than 90% of companies in Chemicals and Food Processing set environmental targets. This is the lowest for Automotive (69%) and Telecommunications (62%) companies. More than 90% of companies in Germany, UK, and US share environmental targets. More than 70% South African, more than 60% Indian and Turkish companies share environmental targets, which is lowest for Chinese companies (38%).
- More than 85% of companies in Chemicals, Consumer Goods, and Food Processors set environmental targets, coverage, and depth in reporting environmental targets (more than 75% in more than 3 areas).
- Climate Change is the highest for target sharing:
- Highest for Chemicals, Food Processors, and Natural Resources (more than 80%),
- Highest for Germany, US, and UK (more than 90%),
- China is lagging in sharing Climate Change targets (38%).
- Higher in SASB (97%), GRI and UNGC (both 88%), and <IR> (71%).
- Energy is highest for Consumer Goods and Chemicals, medium across all industries and countries. Highest for US and Germany; SASB and UNGC companies outperform.
- More than 75% in Chemicals and Food Processors define Water as an environmental target. It is highest for the US, and very low for China.
- Waste & Packaging led by Food Processors and Consumer Goods (more than 85%).
- Hazardous Materials, Biodiversity, and Responsible Sourcing is low across all countries. Responsible Sourcing, Chemicals & Hazardous Materials highest in Germany (68% and 44%).
- Responsible Sourcing is high for Chemicals (61%), Consumer Goods (62%), and Food Processors (64%).
- All SASB companies share environmental sustainability targets. They are followed by UNGC (95%), GRI (89%), and <IR> (81%) companies. Those that do not adopt any of the initiatives share environmental targets lower (61%).
- SASB companies outperform in environmental targets.

- All German companies set social targets. Followed by UK and US companies (both more than 75%).
- 80% for Natural Resources, lowest for Automotive (54%) and Utilities (56%).
- Highest for SASB and UNGC (both more than 80%).
- German companies set targets in occupational health & safety, and diversity & inclusion more than the others (both more than 90%).
- Occupational Health and Safety:
- Highest in Germany (92%), US (63%), and South Africa (58%). Lowest in India (29%).
- Highest in Natural Resources (77%), Chemicals (67%), Machine & Equipment (63%), and Food Processors (59%).
- 72% of UNGC companies set occupational health and safety targets.
- Diversity & Inclusion:
- More than 50% for Automotive, Machine & Equipment, and Telecommunications.
- 92% of German companies set targets.
- Lowest for Türkiye, India, China, UK, and US.
- Companies that adopt an initiative outperform.
- Product Design & Portfolio is highest for Germany.
- Data Security and Customer Privacy lowest in all categories.

- All UK and South African companies set governance targets. Almost all companies in the US (98%) and Germany (96%) set governance targets. Chinese companies have the biggest room for improvement in governance targets.
- Coverage is more than 90% in Consumer Goods, Food Processors, Machine & Equipment, Pharma, and Retail. Lowest in Automotive (54%).
- All SASB companies set governance targets. More than 95% in <IR> and UNGC, and 90% for GRI companies do so. Companies that adopt an initiative outperforms.
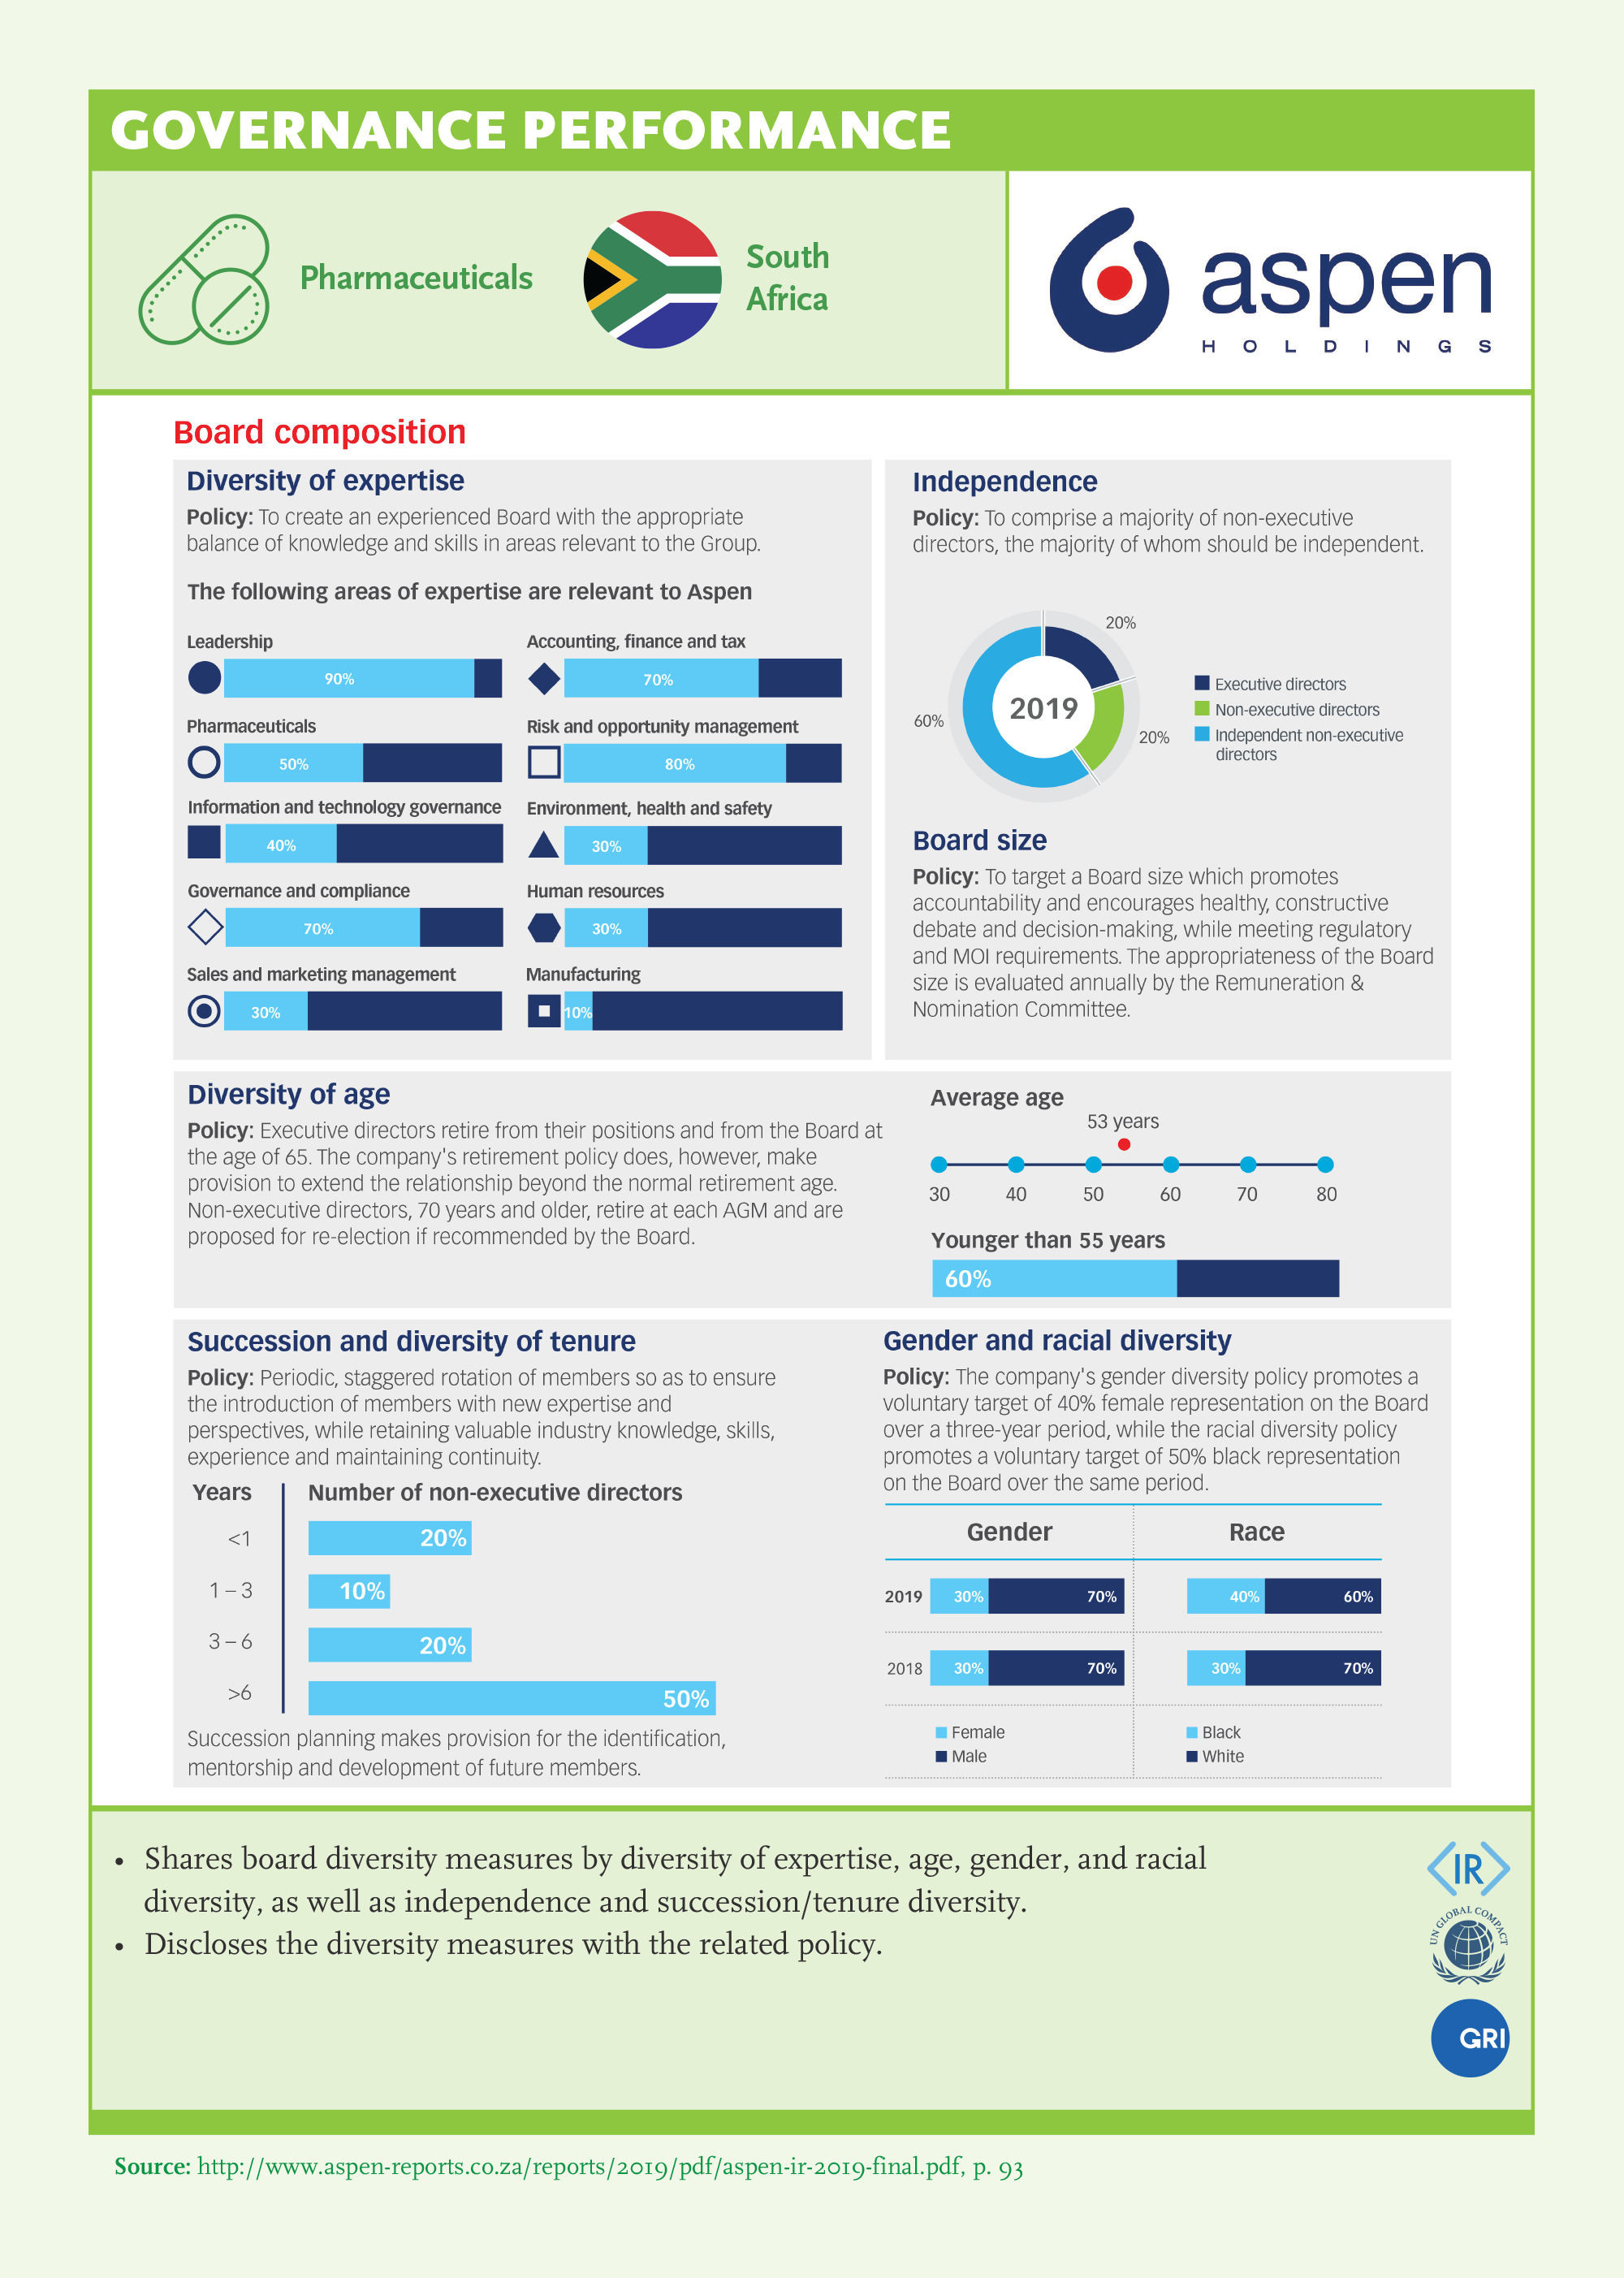
- Board diversity is highest for German and UK companies (both more than 80%). Lowest in Automotive (31%). None of the initiatives outperform the board diversity targets.
- Executive compensation sharing is more than 90% in the US, UK, and South Africa, not available in India or Türkiye. Room for improvement in Automotive and Telecommunications is obvious. SASB and <IR> companies are the best performers ( both more than 90%).
- Target for compliance is lowest across all countries, industries, and initiatives. It is highest for German companies (56%).
Sustainability Stewardship
Taking a reactive approach to sustainability is not sufficient. Companies should move from focusing on short-term profits to long-term impact and from a shareholder-centric view to a stakeholder-centric one. This requires not only managing the negative and positive sustainability impacts of the company’s operations but also taking responsibility for the company’s wider sphere of influence. There are a few companies taking the lead towards a proactive approach to sustainability and assuming leadership for their ecosystems, which requires a complete overhaul of traditional performance models. However, examples of this are not yet widespread even among the GSLs.
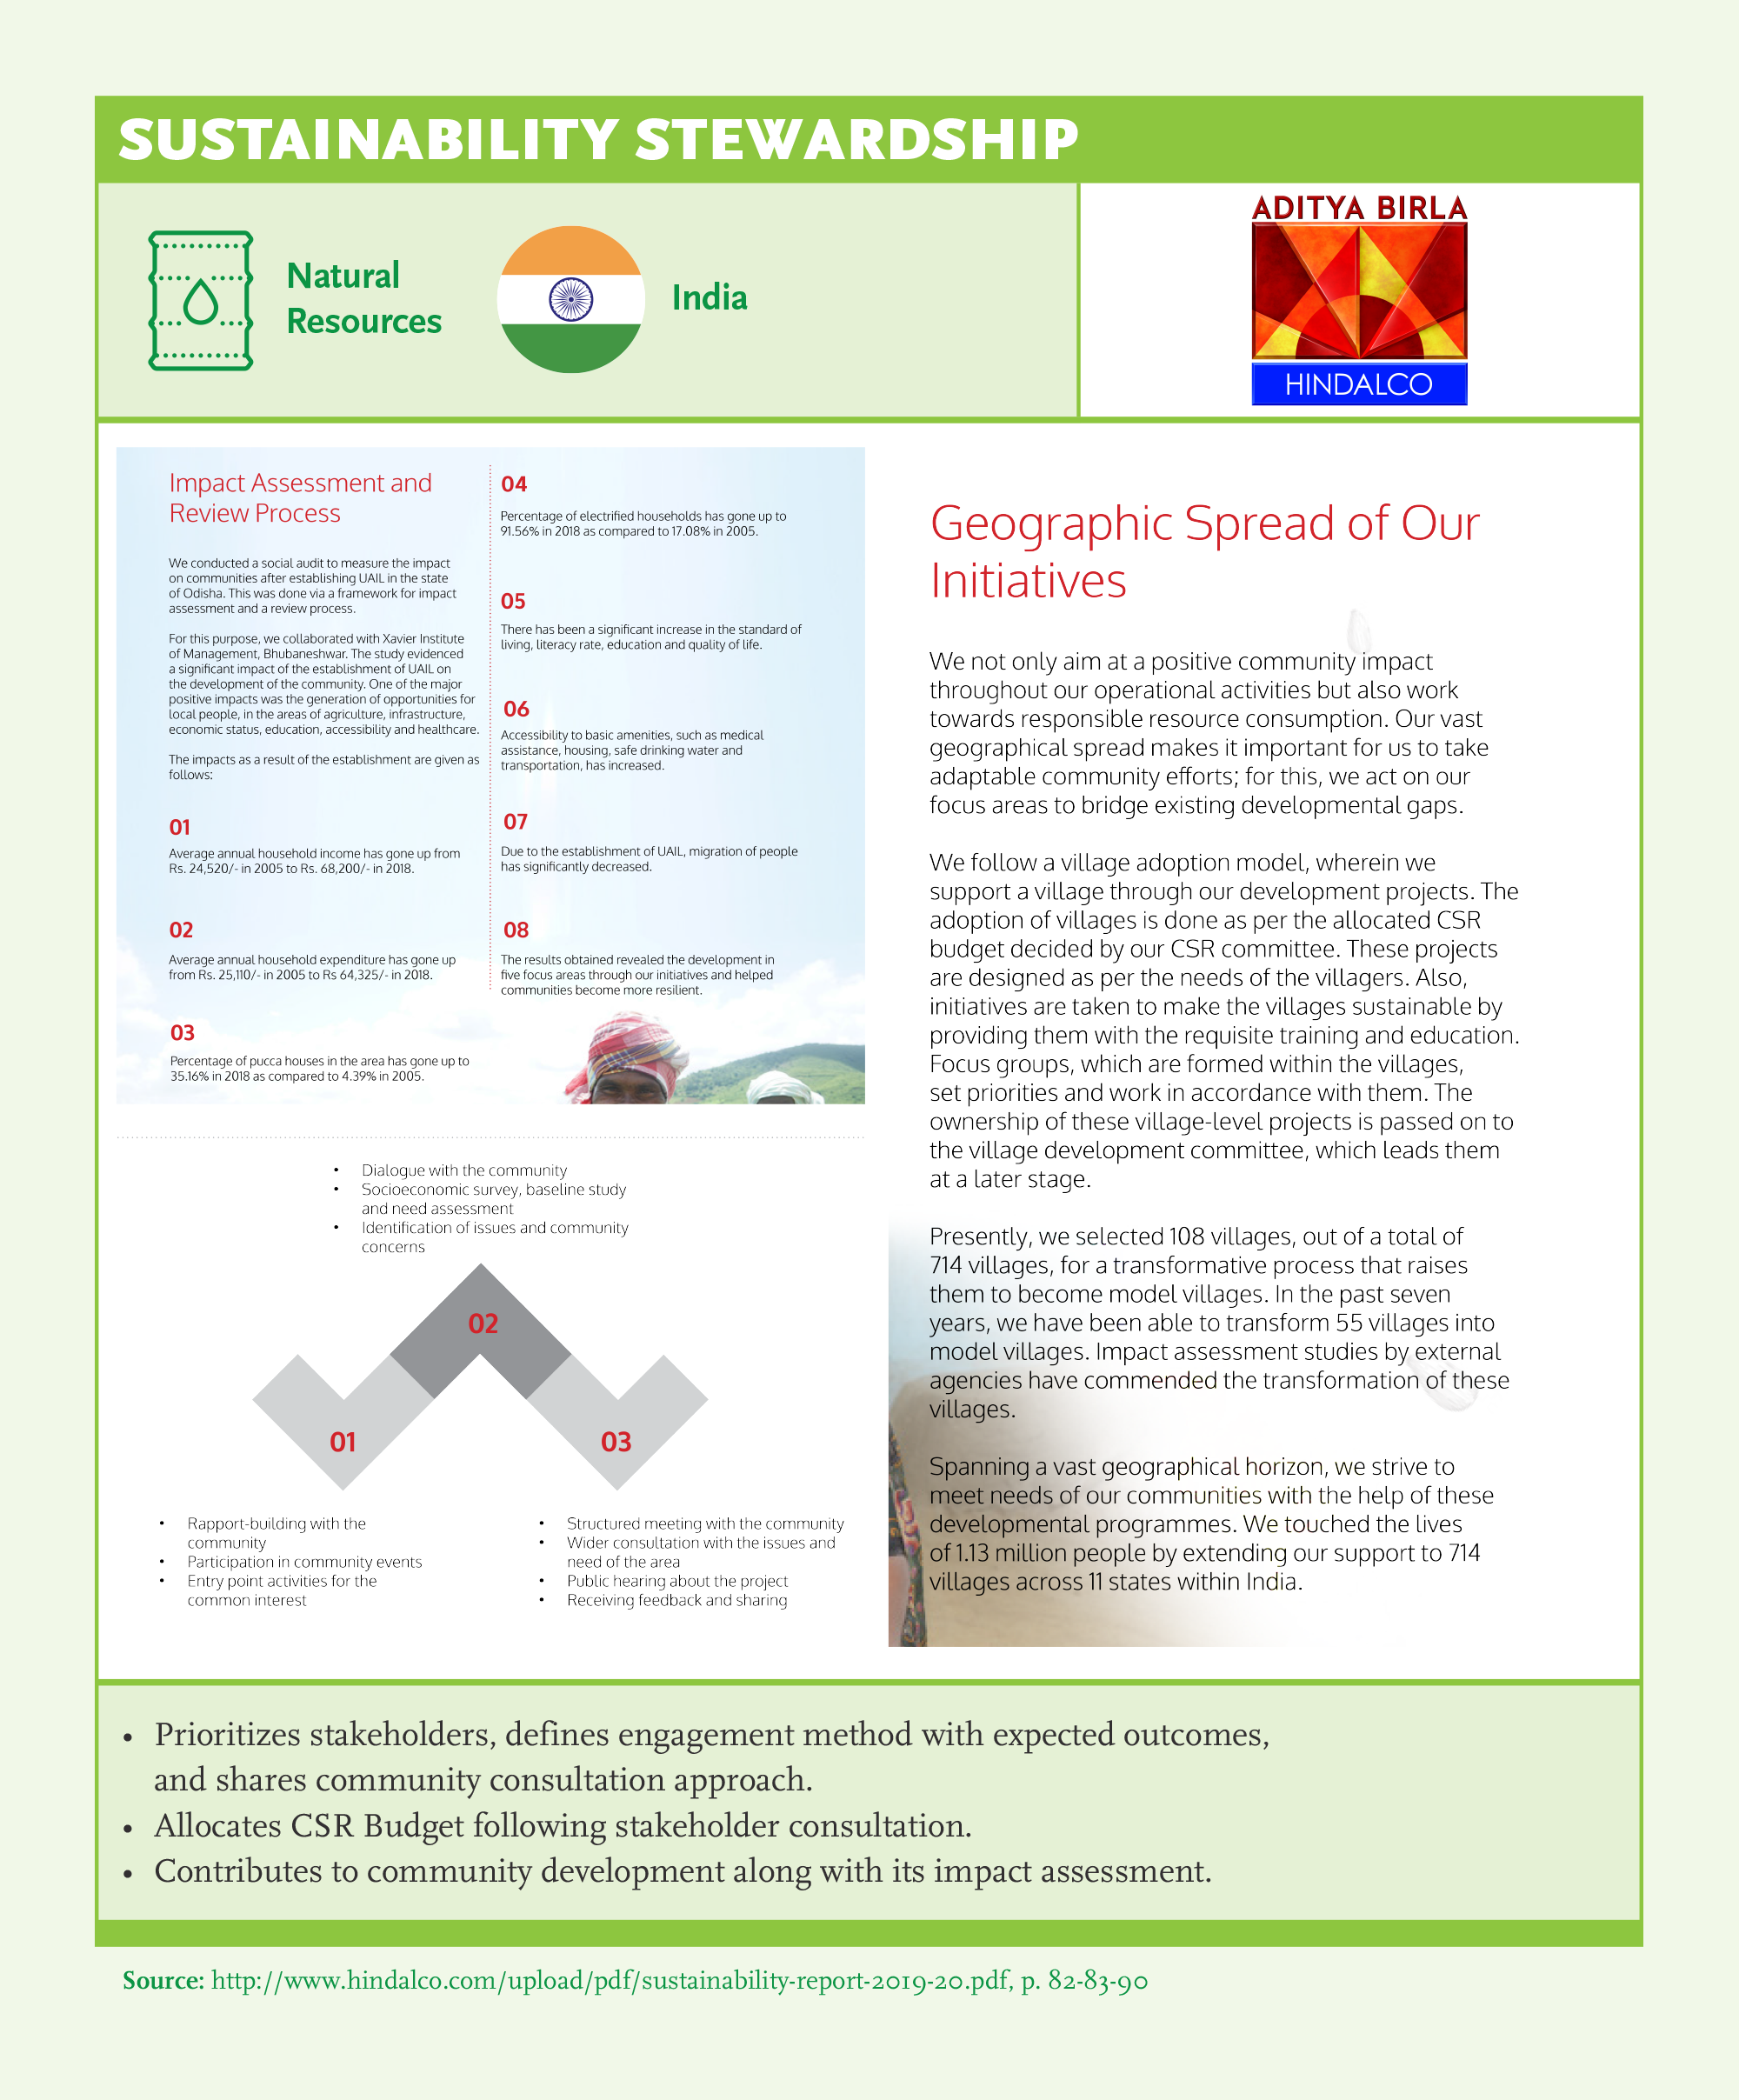
Managing your ecosystem includes taking responsibility for the environment, communities, and networks in which the company operates. Environmental stewardship can include protecting watersheds or biodiversity to ensure the continuity of natural resources for future generations. Social stewardship can include investing in communities and positively influencing stakeholders in the ecosystem in which the company operates through awareness and behavior change campaigns and training. For governance, the concept of stewardship would require assuming responsibility for improving the business climate. Ecosystem responsibility requires pursuing non-traditional partnerships between public, private, and social spheres, or between competitors within the same industry to accelerate impact towards the Sustainable Development Goals (SDGs).
Recommendations
- 1Manage your company as well as your ecosystem.
- 2Cooperate and partner for impact for a step-change in how we do business.
- 3Pursue industrial collaboration to define what matters and invest in measurement and reporting systems.
Key Findings

- Almost all GSLs share ESG results and most set targets across ESG (81%, 70%, and 86%). There is an increasing trend in setting targets for sustainability areas in comparison to SGS 2020.
- Companies tend to share results and set targets for their ecosystem more often than the value chain in social and governance issues. However, it’s contrary to environmental issues. For environmental issues, GSLs share results and targets for the value chain more frequently than their ecosystem.
For Value Chain
- German and US companies are highest in sharing targets for the value chain (76% and 63%). It is highest for environmental issues, lowest for governance; also lowest for Chinese companies (8%) –none for environmental and social targets for the value chain.
- Food Processors, Chemicals, and Consumer Goods share more than 60%.
- UNGC and SASB companies have the highest percentage (69% and 67%). It is lower for <IR> and GRI companies in terms of E, S, and G subcategories.
For Ecosystem
- Highest for German and US companies (68% and 59%), and lowest for Turkish companies (21%). Social and Governance issues are covered more than Environmental issues for the ecosystem. Social and Governance related targets are set most often by German, South African, and US companies.
- Highest in Consumer Goods (77%), followed by Chemicals (67%).
- Targets in “Partnership for Goals” are mostly set by Consumer Goods and Chemicals (more than 60%).
- In terms of initiatives, UNGC companies share ecosystem targets more often (more than 65%).

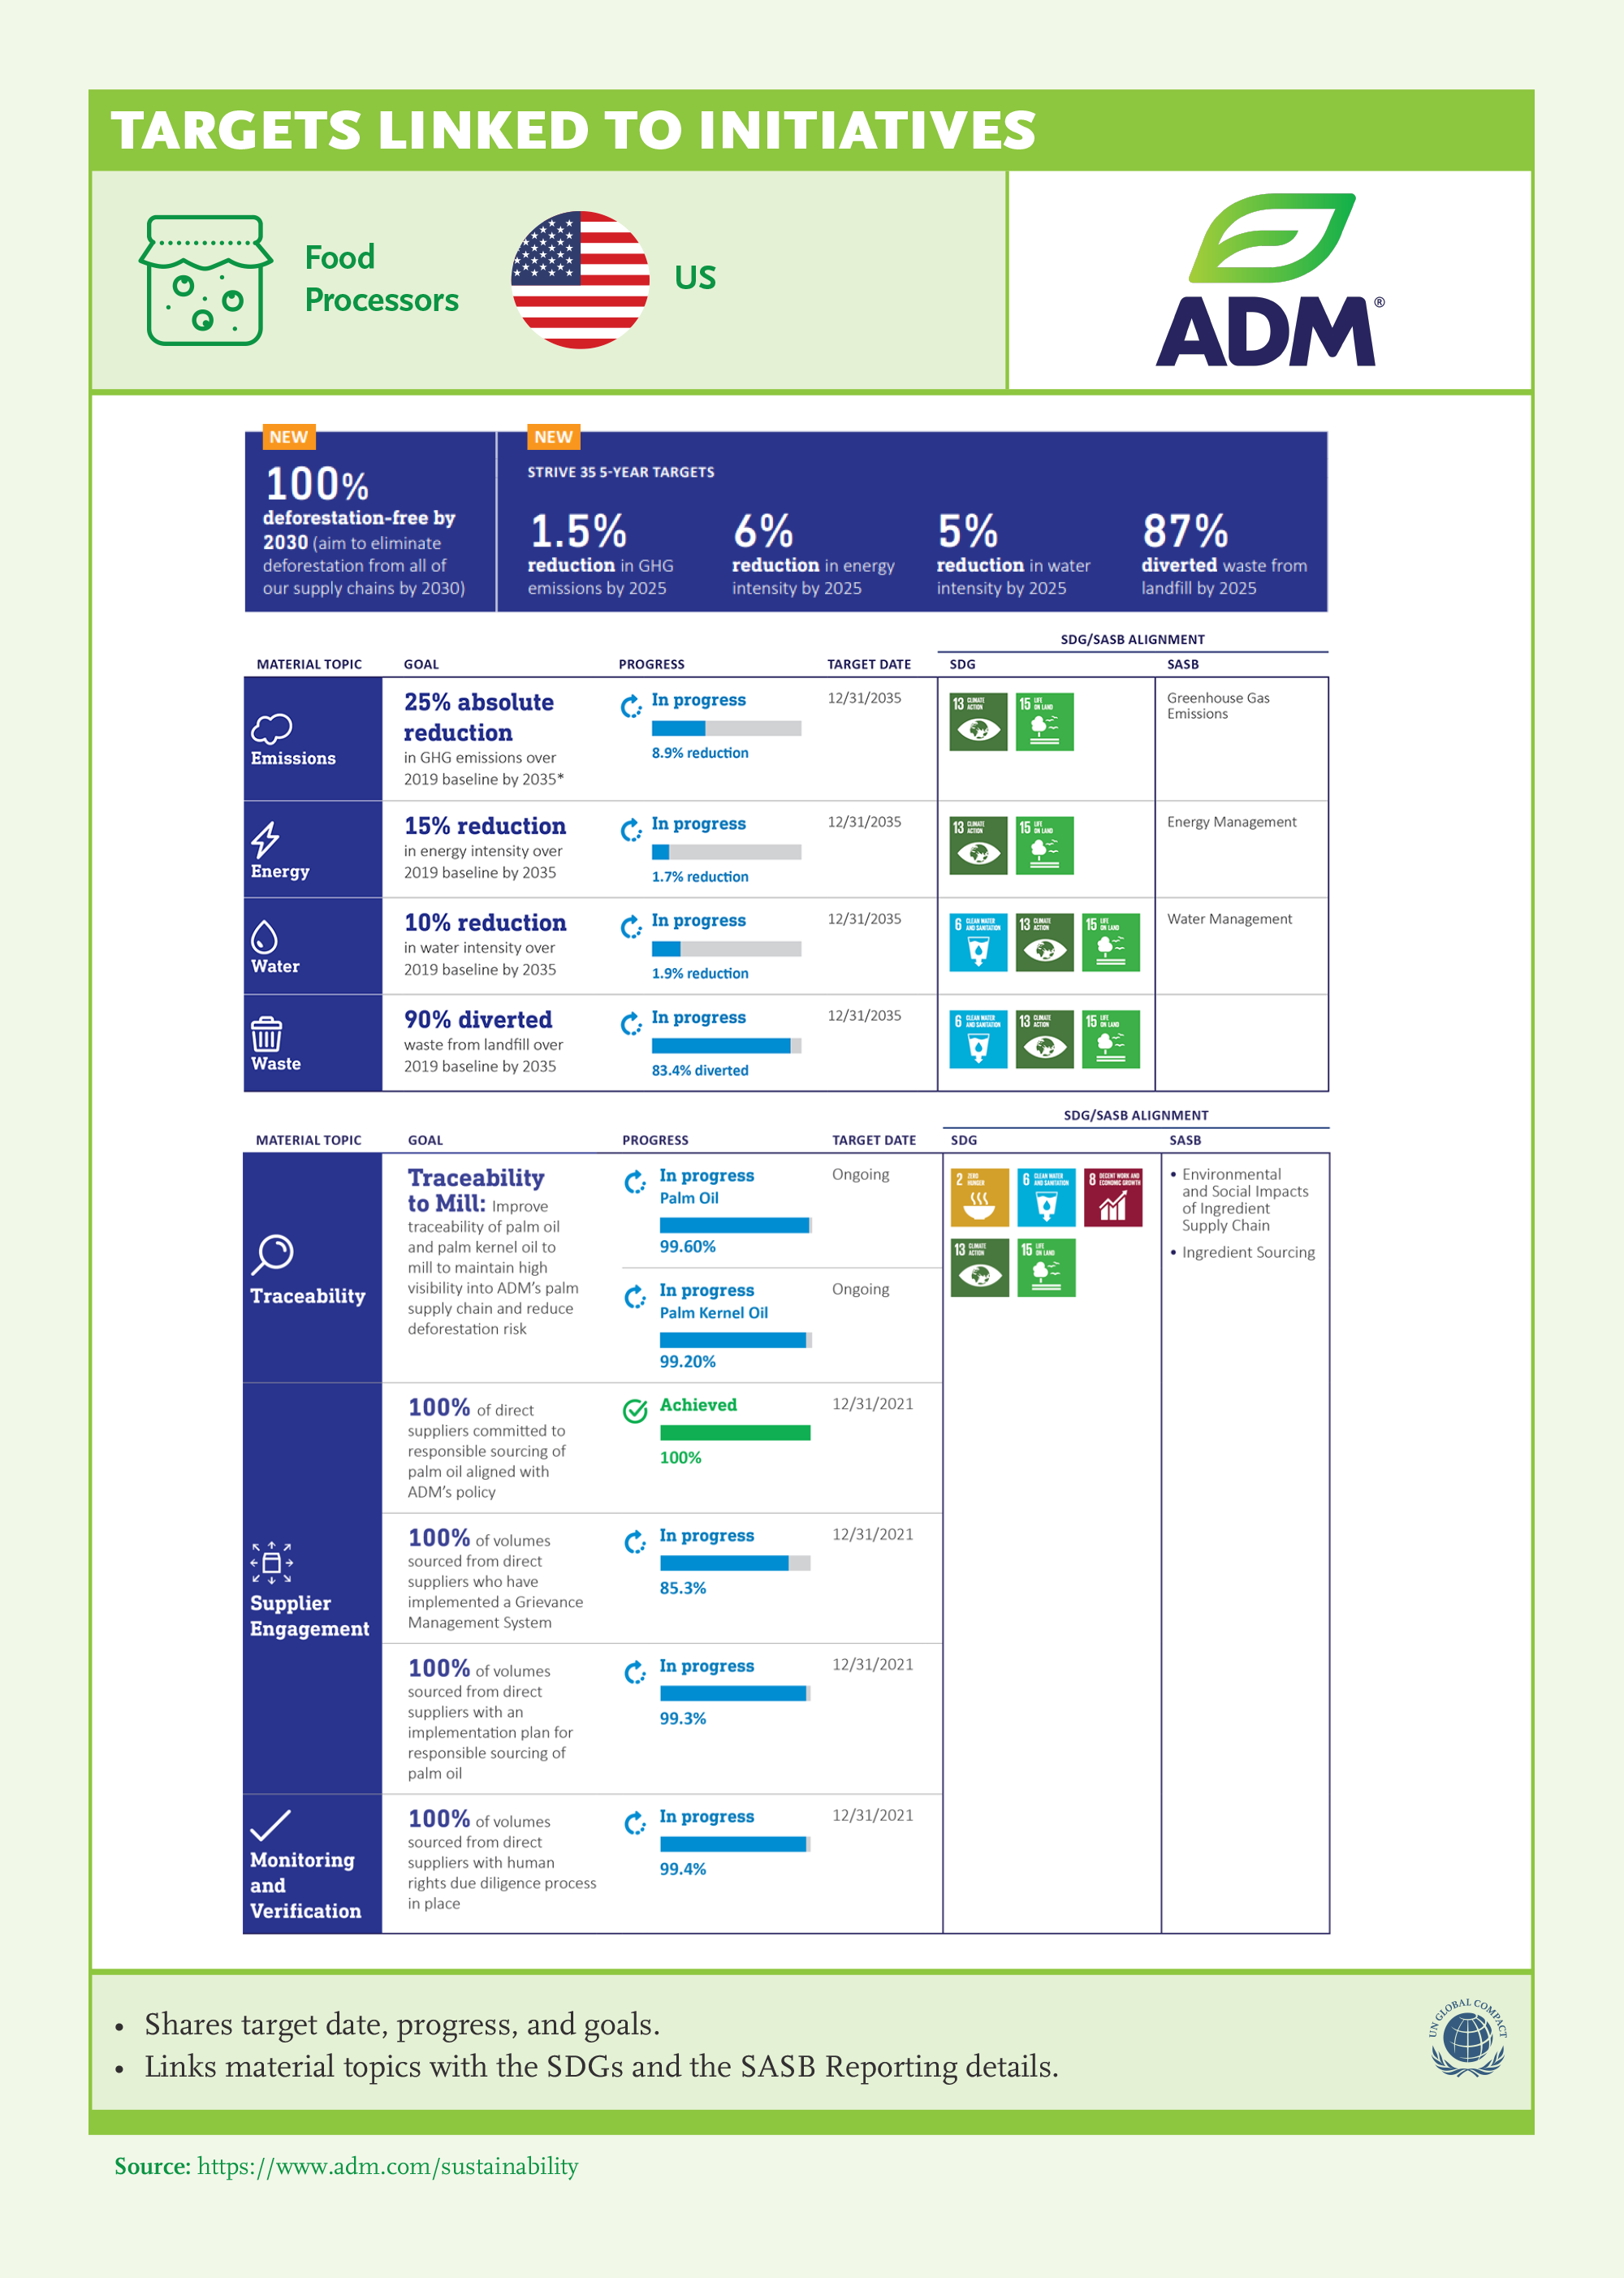
Link to SDGs
Sustainable Development Goals (SDGs) define global sustainable development priorities and aspirations for 2030 and seek to mobilize global efforts around a common set of goals and targets. In 2015, the SDGs were approved by almost 200 countries as a common framework on how to focus their actions for a sustainable future. In 2019, world leaders convened to take stock of SDG progress where the Secretary General emphasized the need to close the action-intention gap. Looking forward to 2030, corporations should take leadership and mobilize stakeholders if we are to reach the SDG targets for 2030.
Awareness about the importance of changing behaviors for a sustainable future as well as commitment to action is increasing. However, there is a need to act fast and scale up the progress. The SDGs can be utilized as a tool to connect business strategies with global priorities, and have a significant impact on the environment and social structure in which a business will operate in the future. The SDGs present an opportunity for business-led solutions and technologies to be developed and implemented to minimize negative effects and maximize positive impacts on people and the planet.
Recommendations
- 1Link SDGs with strategy and prioritize them.
- 2Quantify your contribution for stakeholders.
- 3Focus on a few things that matter most to drive impact.
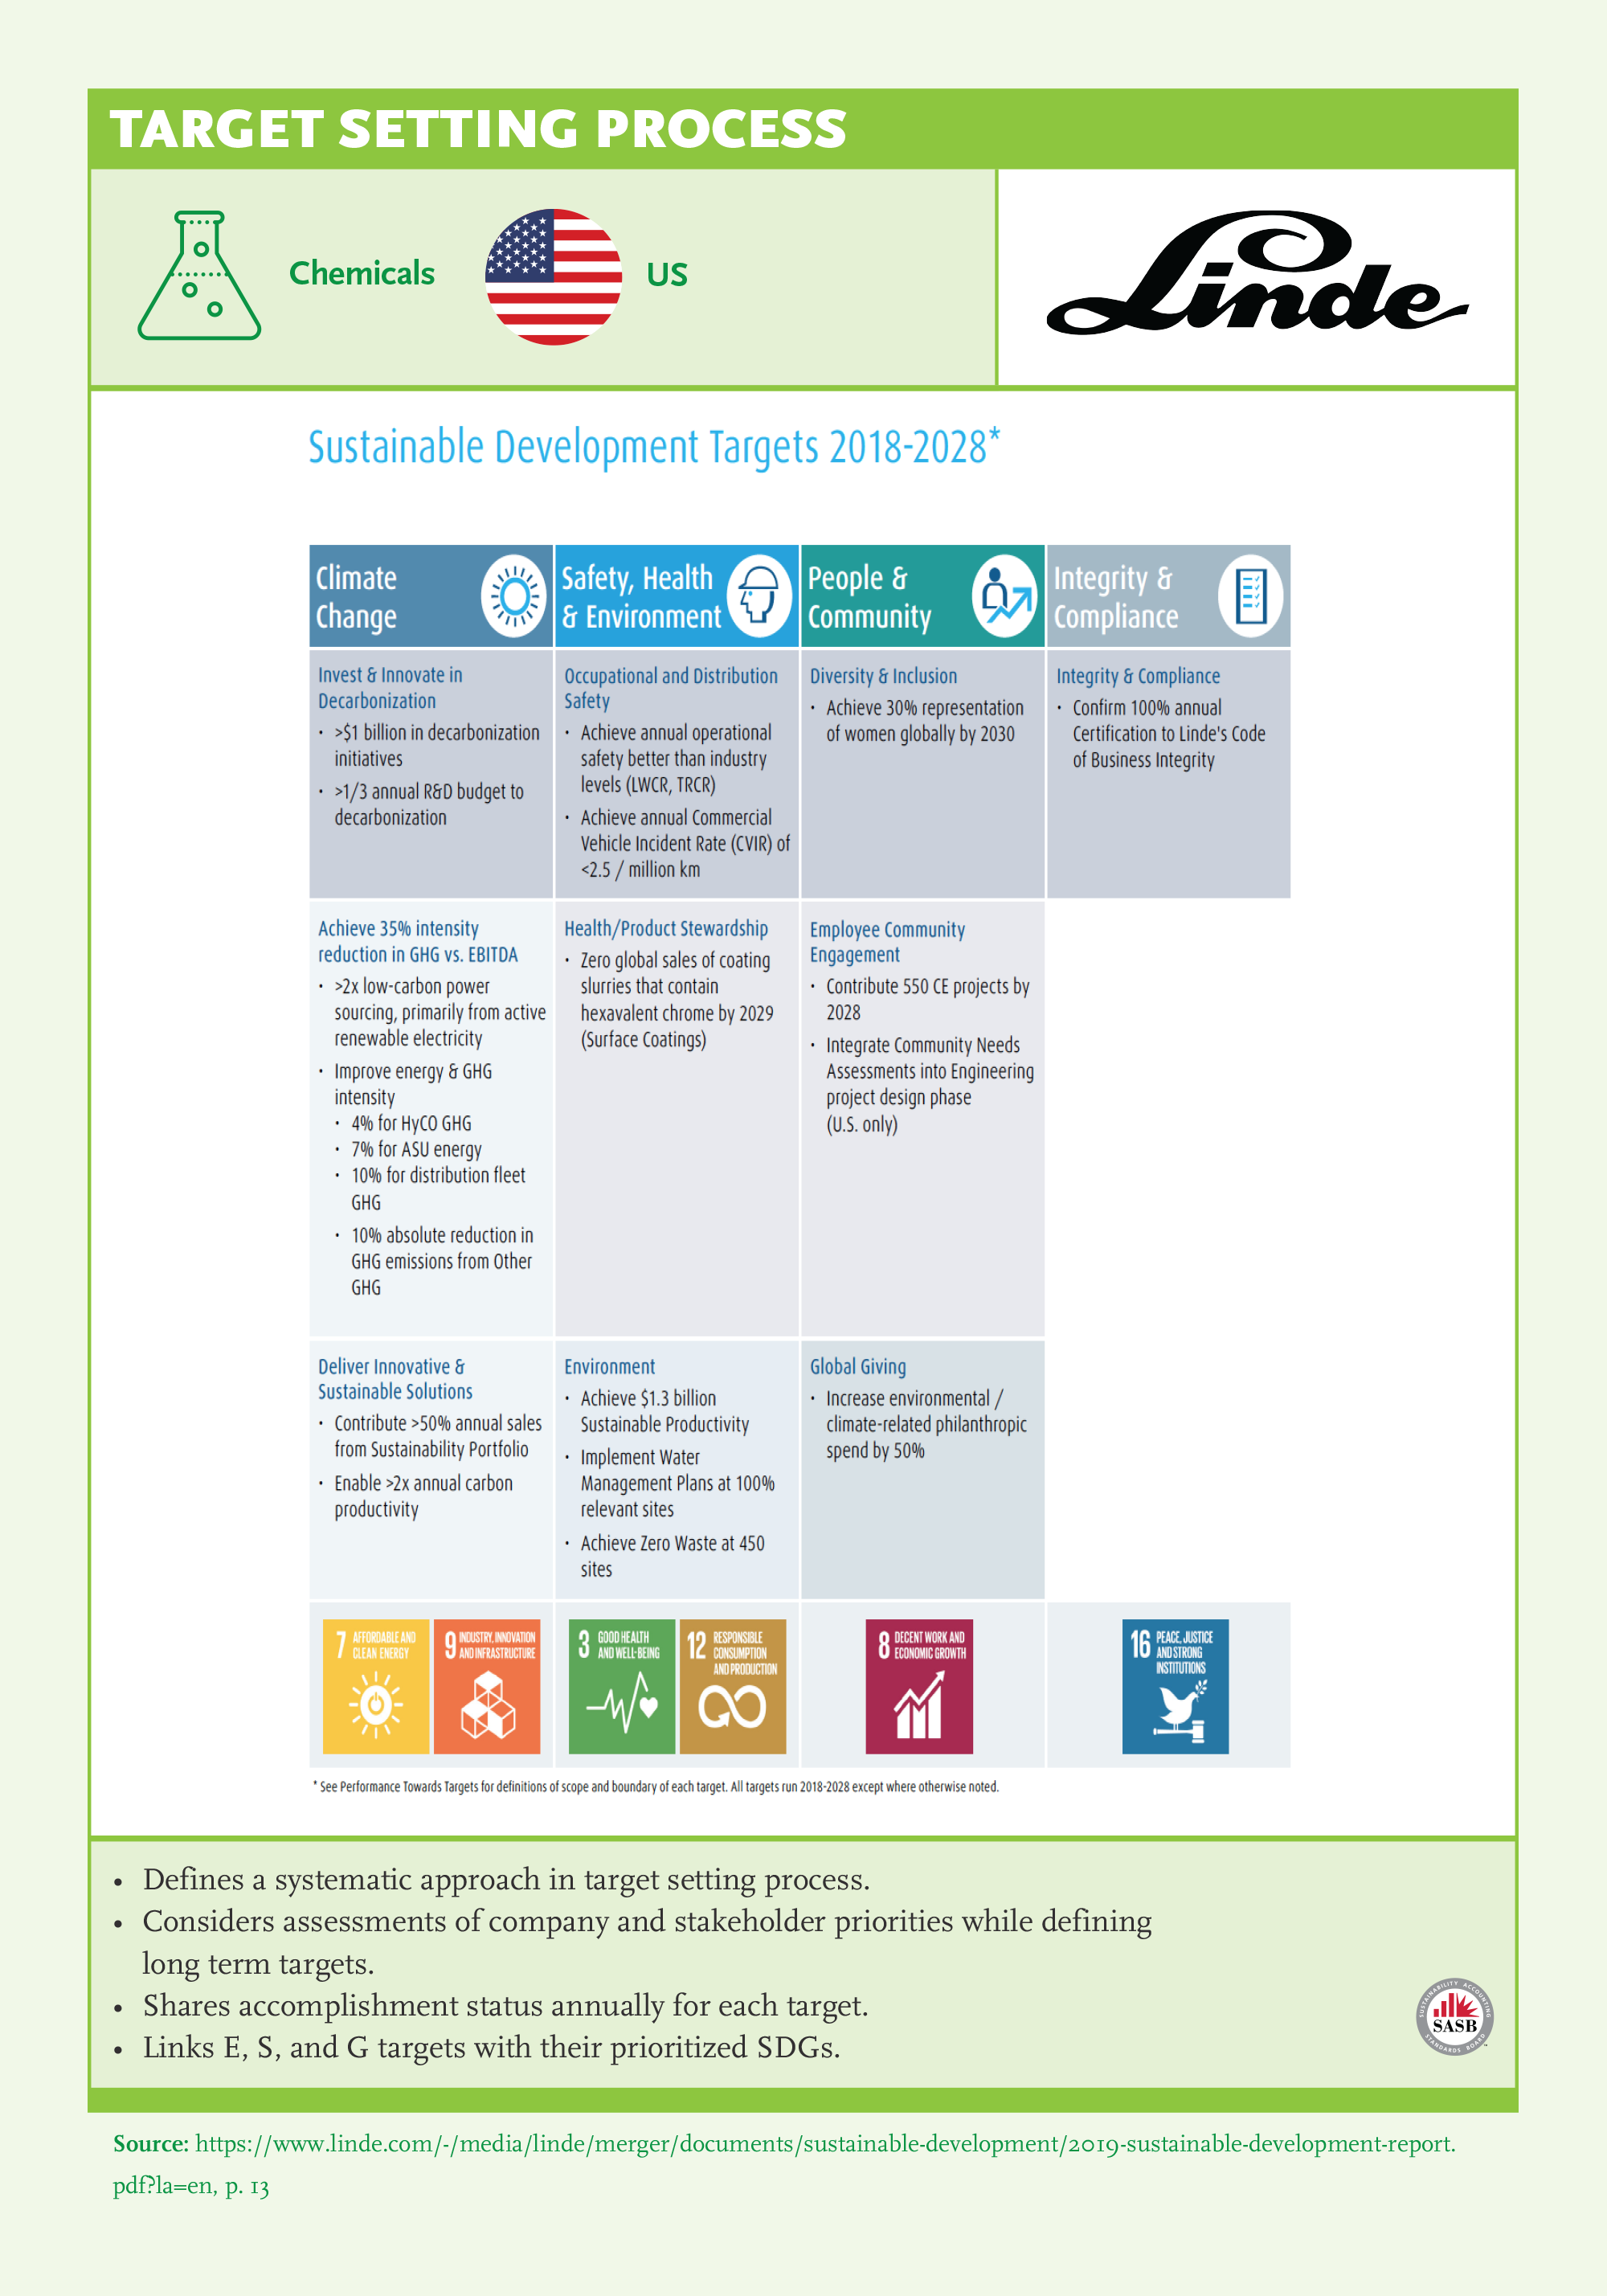
- 4Make it specific, show links to sub-targets –preferably at target level.
- 5Set targets and measure progress –quantify your direct contribution.
- 6Develop and share an action plan to address gaps.
- 7Think of your ecosystem.
- 8Partner for an industry-level impact.
Key Findings
The SDGs have a significant impact on the environment and social structure in which a business will operate in the future. Sustainability Governance Scorecard analyses the strategic alignment with the SDGs, sharing the results, and setting specific targets for focused SDGs.

- There is a positive trend towards adopting SDGs compared to the past two years, but there is room for improvement, especially in results alignment and setting targets for SDGs. In comparison to SGS 2020, link to the SDGs increased by 13% both for strategy alignment (from 73% to 86%), and results alignment (from 58% to 71%). Target setting for aligning with the SDGs is 50%.
- Similar to SGS 2020, strategy and results alignment is highest for SDG 8 (77% and 63%), SDG 13 (78% and 66%) and SDG 12 (68% and 54%) –focusing on areas relevant to the core value proposition.
- Strategy and results alignment is highest for SDG 14: Life Below Water (37% and 28%), SDG 11: Sustainable Cities and Communities (47% and 38%), SDG 16: Peace and Justice Strong Institutions (38% and 29%), and SDG 5: Gender Equality (66% and 57%).
- Strategy and results alignment is lowest for SDG 8: Decent Work and Economic Growth (77% and 63%). Even if SDG 8 is one of the top 3 adopted SDGs, sharing results and defining targets related to the SDGs should be higher.
- In comparison to SGS 2020, the highest increase in strategy and results alignment is for SDG 4: Quality Education, SDG 5: Gender Equality, and SDG 3: Good Health and Well Being, followed by SDG 16: Peace and Justice Strong Institutions.


- In each industry, companies on average link their strategy with 10 of the 17 SDGs and share results linked to SDGs with 8 of them.
- Companies in Natural Resources link their strategy with 12 of the SDGs; Chemicals, Consumer Goods, Retail, Food Processors with 10; Utilities, Telecommunication, Automotive, Pharma with 9 of the SDGs. Industrial performance for SDG linkage is very low for Machine & Equipment across the board (less than 40% across all SDGs), however there is an improvement in comparison to SGS 2020 (linkage was below 30% and none of the SDGs were adopted by more than half of the companies in the industry). This signals that consumer-facing industries have been influenced by public sensitivity on working towards global goals and sustainability agenda, while B2B industries such as Machine & Equipment are slower to adopt global goals.
- SDG 8 is adopted by more than 50% of the companies in all industries. It is followed by SDG 7, 5, 12, and 13. Those SDGs are adopted by almost all industries (more than 50% in 9 of 10 industries).
- The Machine & Equipment industry shows progress in comparison to SGS 2020. Last year, none of the SDGs were adopted by more than 50% of the companies. This year, SDG 6, 7, 8, and 9 were adopted by more than 50%.
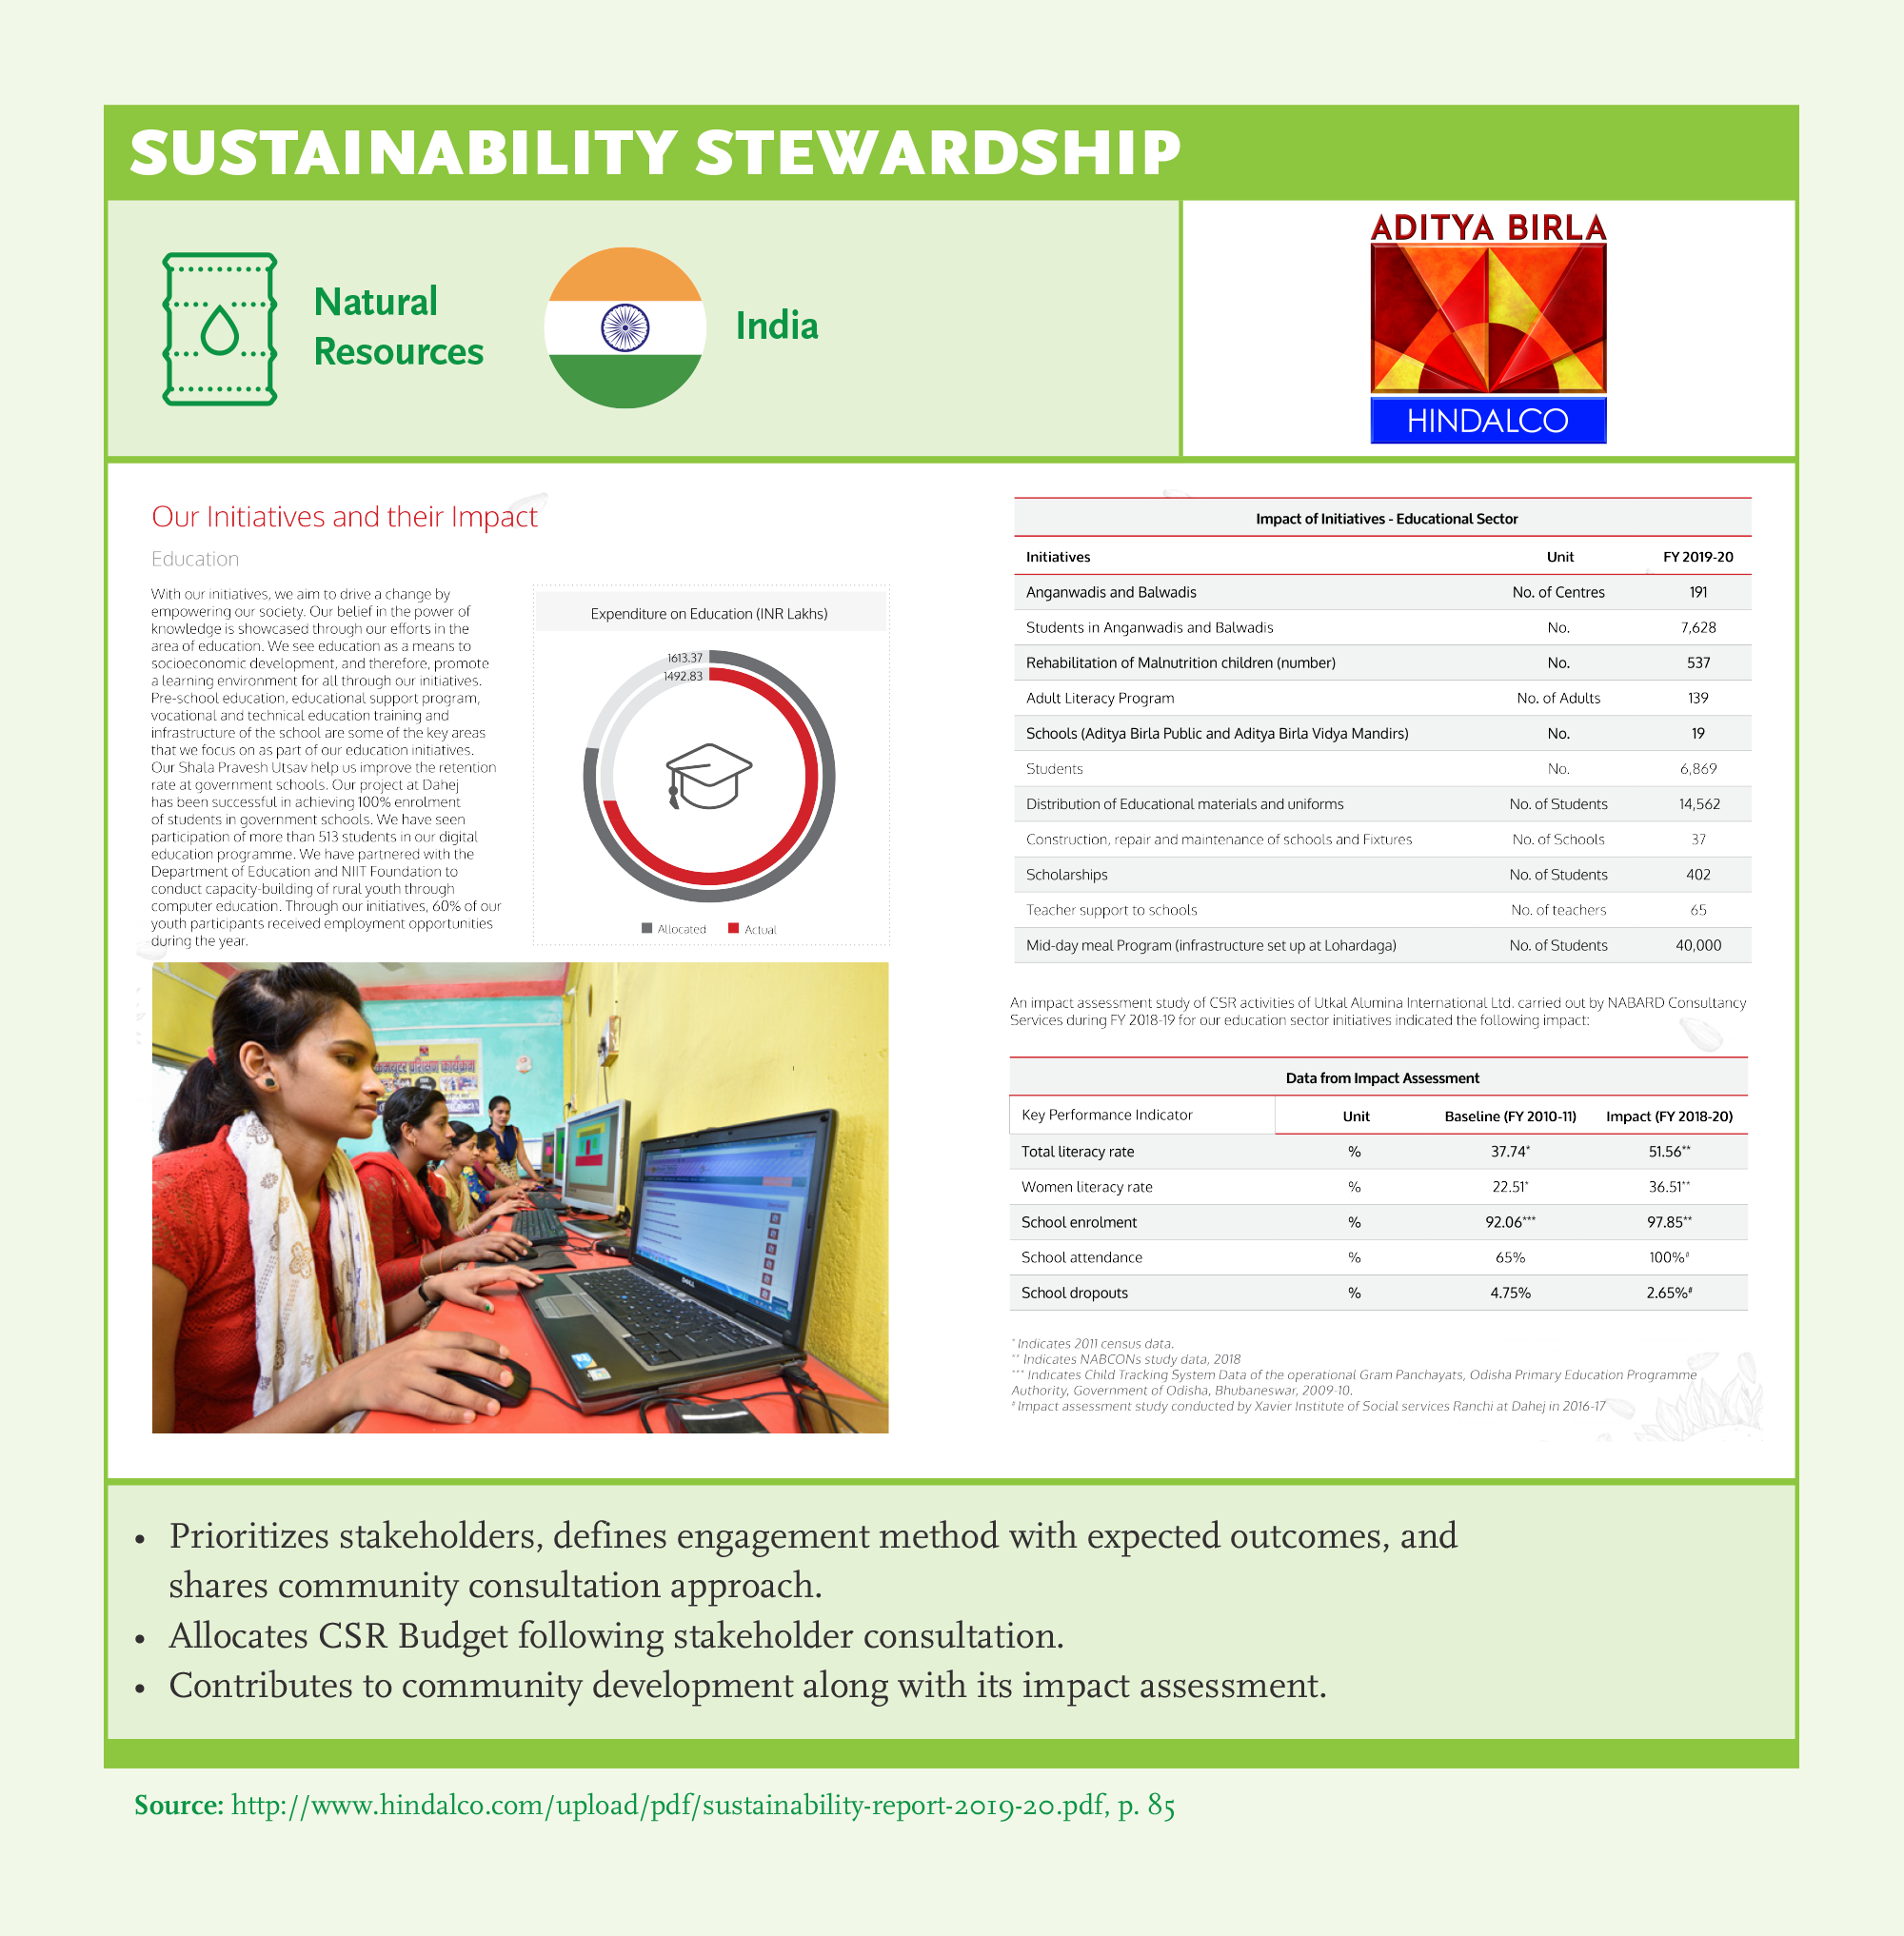
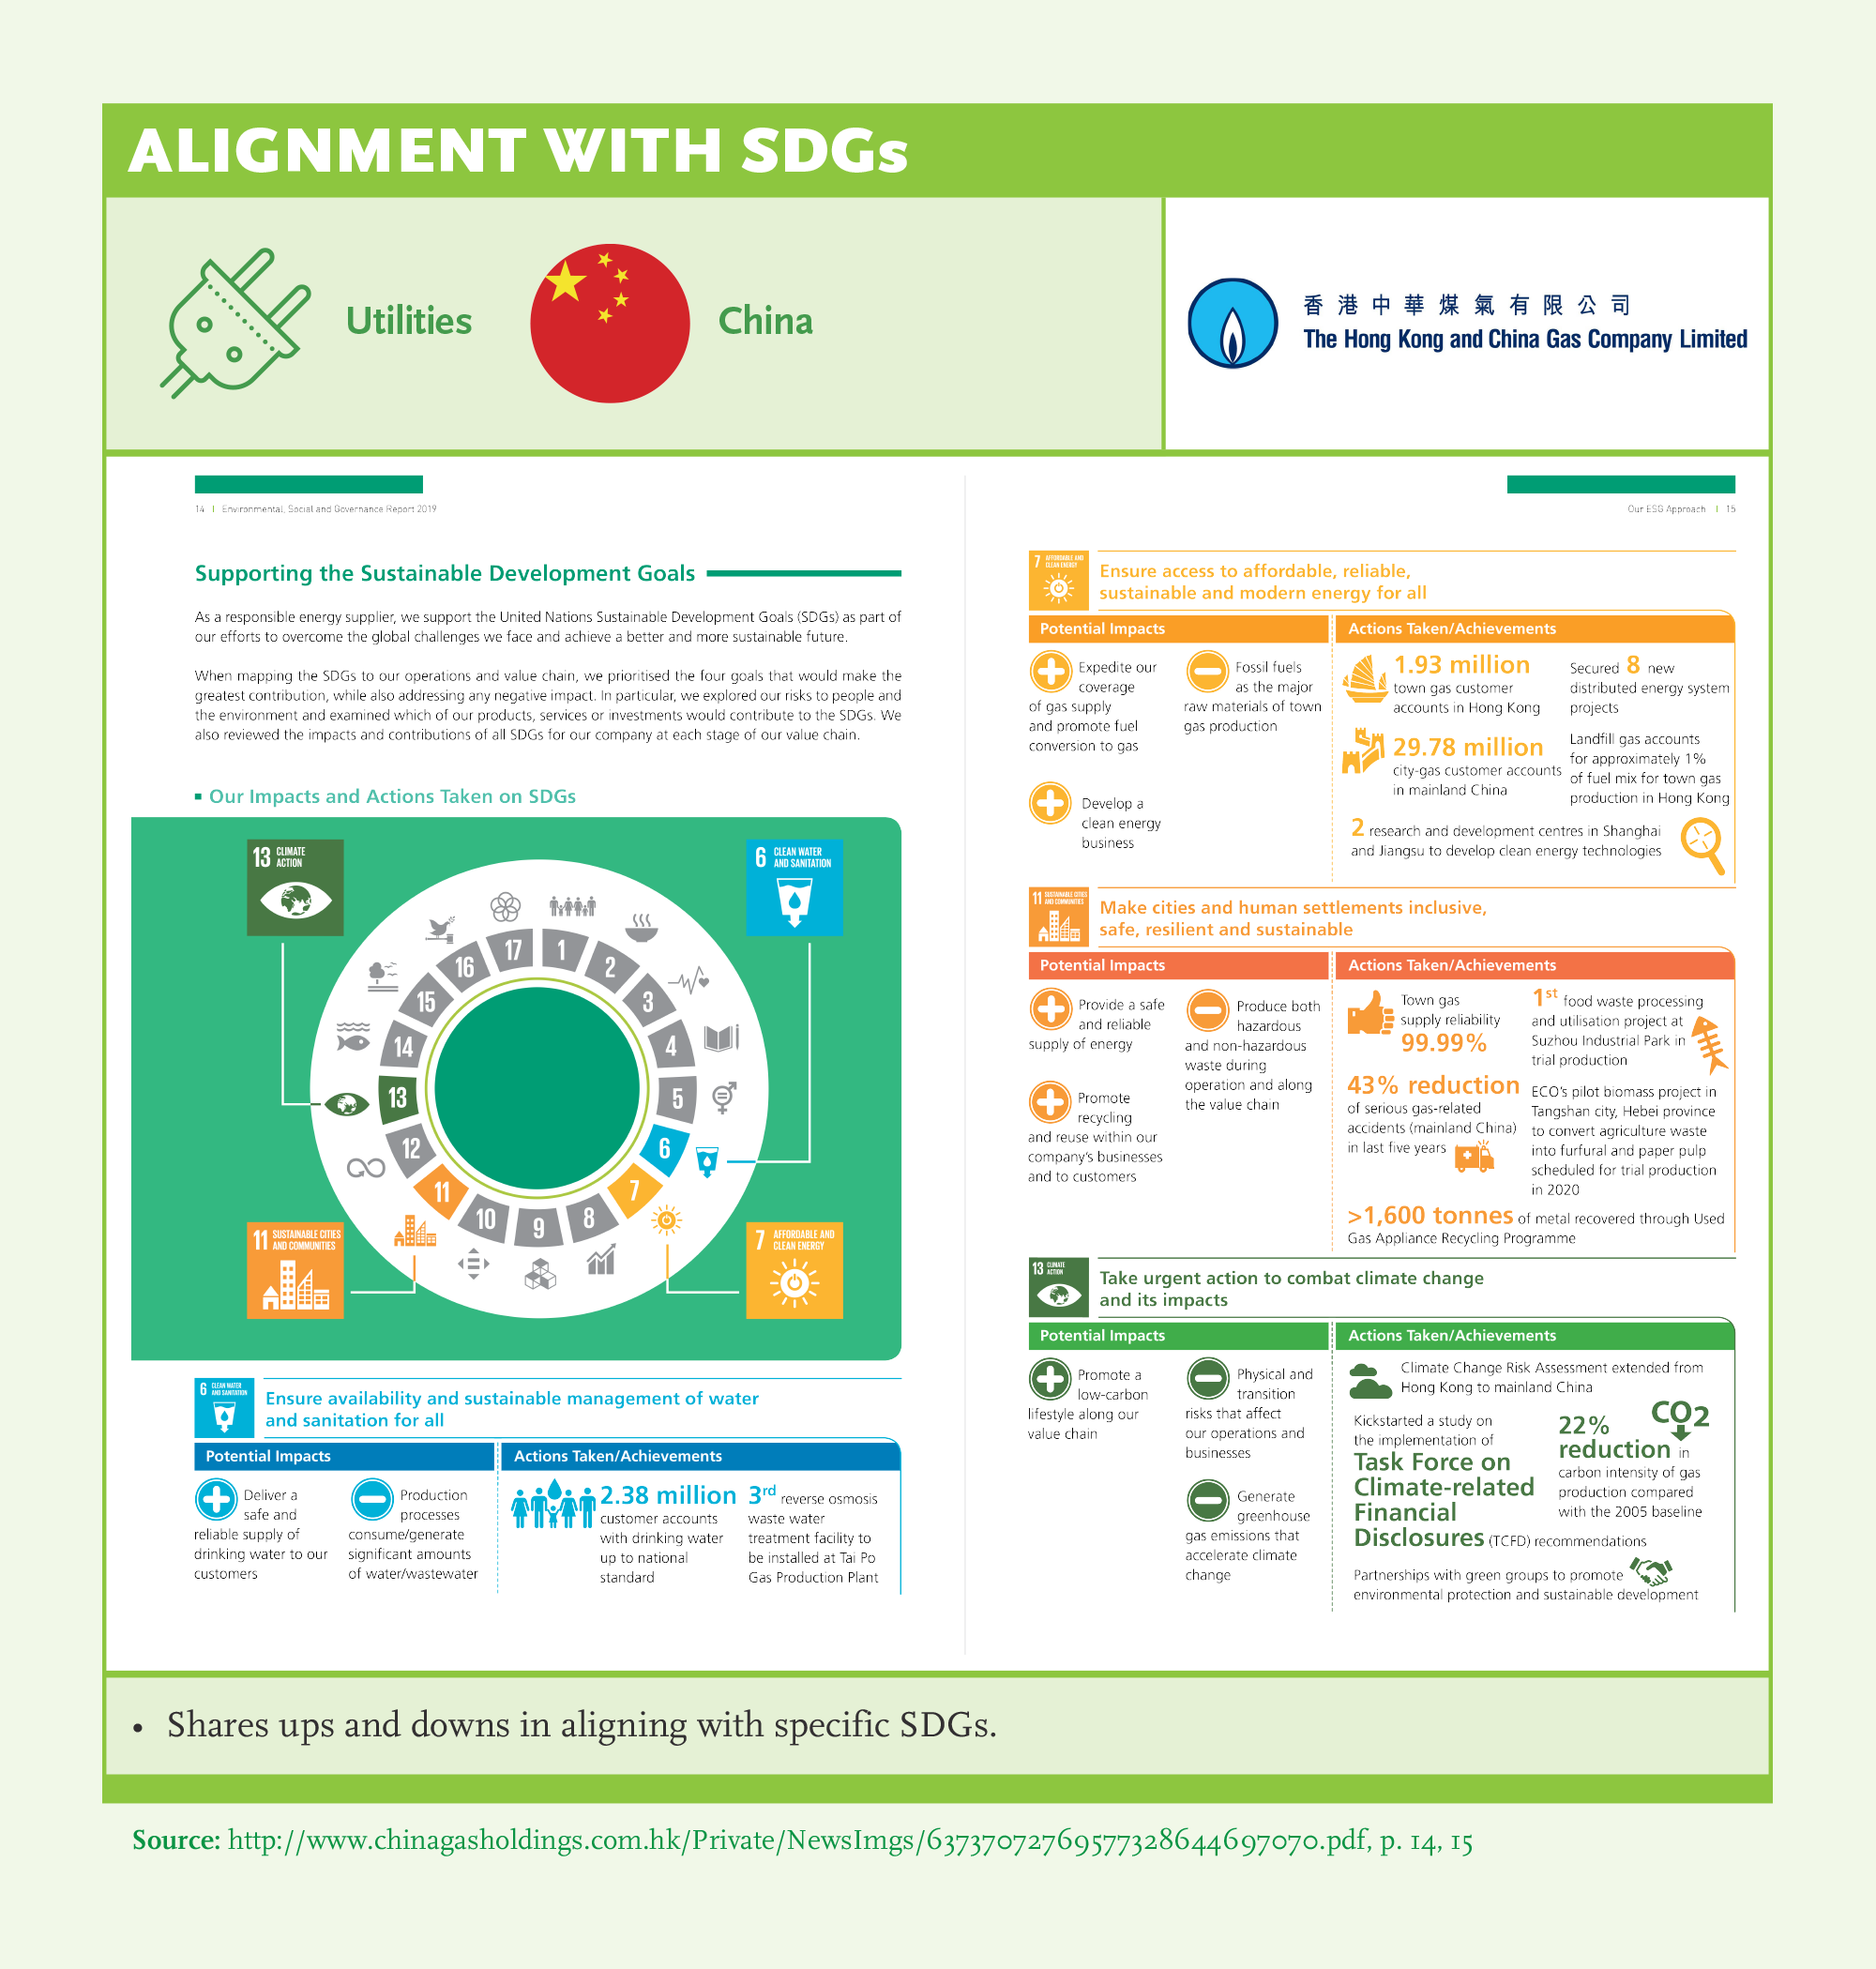
- There is more than 50% adoption of specific SDGs in different industries: Chemicals (SDG 12), Consumer Goods (SDG 13), Food Processors (SDG 13), Natural Resources (SDG 3, 4, 5, 6, 8, 13, 15, and 17), Pharma (SDG 3, 5, and 13), Retail (SDG 8, 12, and 13), Telecommunications (SDG 4), Utilities (SDG 7, 8, and 13). All these SDGs are adopted by more than 80% of the companies in terms of strategy alignment.
Best Practice Examples